
DataFrame QA
БесплатноНе проверенA research-informed MCP server that enables natural language question answering over local dataframes (CSV, Parquet, or Pandas) with safe, read-only execution a

Описание
A research-informed MCP server that enables natural language question answering over local dataframes (CSV, Parquet, or Pandas) with safe, read-only execution and typed analysis plans.
README
A research-informed MCP server for safe dataframe question answering over local data.
Dumping an entire dataframe into an LLM prompt for every question is an inefficient way to do analytics. It burns context window on raw rows, gets expensive quickly, forces aggressive truncation for real datasets, and can still leave the model guessing instead of calculating. The better pattern is to give the model compact schema context, let it decide what statistics are needed, execute those specific dataframe operations locally, and return the computed facts as focused context for the final answer.
MCP DataFrame QA implements that pattern for MCP-compatible assistants. It turns a local CSV, Parquet file, or Pandas dataframe into a natural-language analytics tool where the LLM proposes a typed analysis plan (not code) and the local server validates and executes that plan with read-only Pandas operations (plan converted to code). The dataframe stays local, the model sees profiles, plans, and results rather than the full table.
The repository ships with a prepared 91,872-row public Zillow Research housing-market dataset, so it is useful immediately after cloning while remaining small enough for GitHub and local Pandas.
The project builds on prior work in dataframe question answering, especially DataFrame QA: A Universal LLM Framework on DataFrame Question Answering Without Data Exposure, and adapts those ideas to a practical, shareable MCP server.
Add an OpenAI, Anthropic, or Gemini API key, then ask questions like:
- "What are the top metros by median list price?"
- "Show average median list price by state."
- "How many metro-months had more than 10,000 active listings?"
- "What are the top markets by new listings?"
The design goal is simple: English in, validated dataframe operations out, no arbitrary code execution by default.
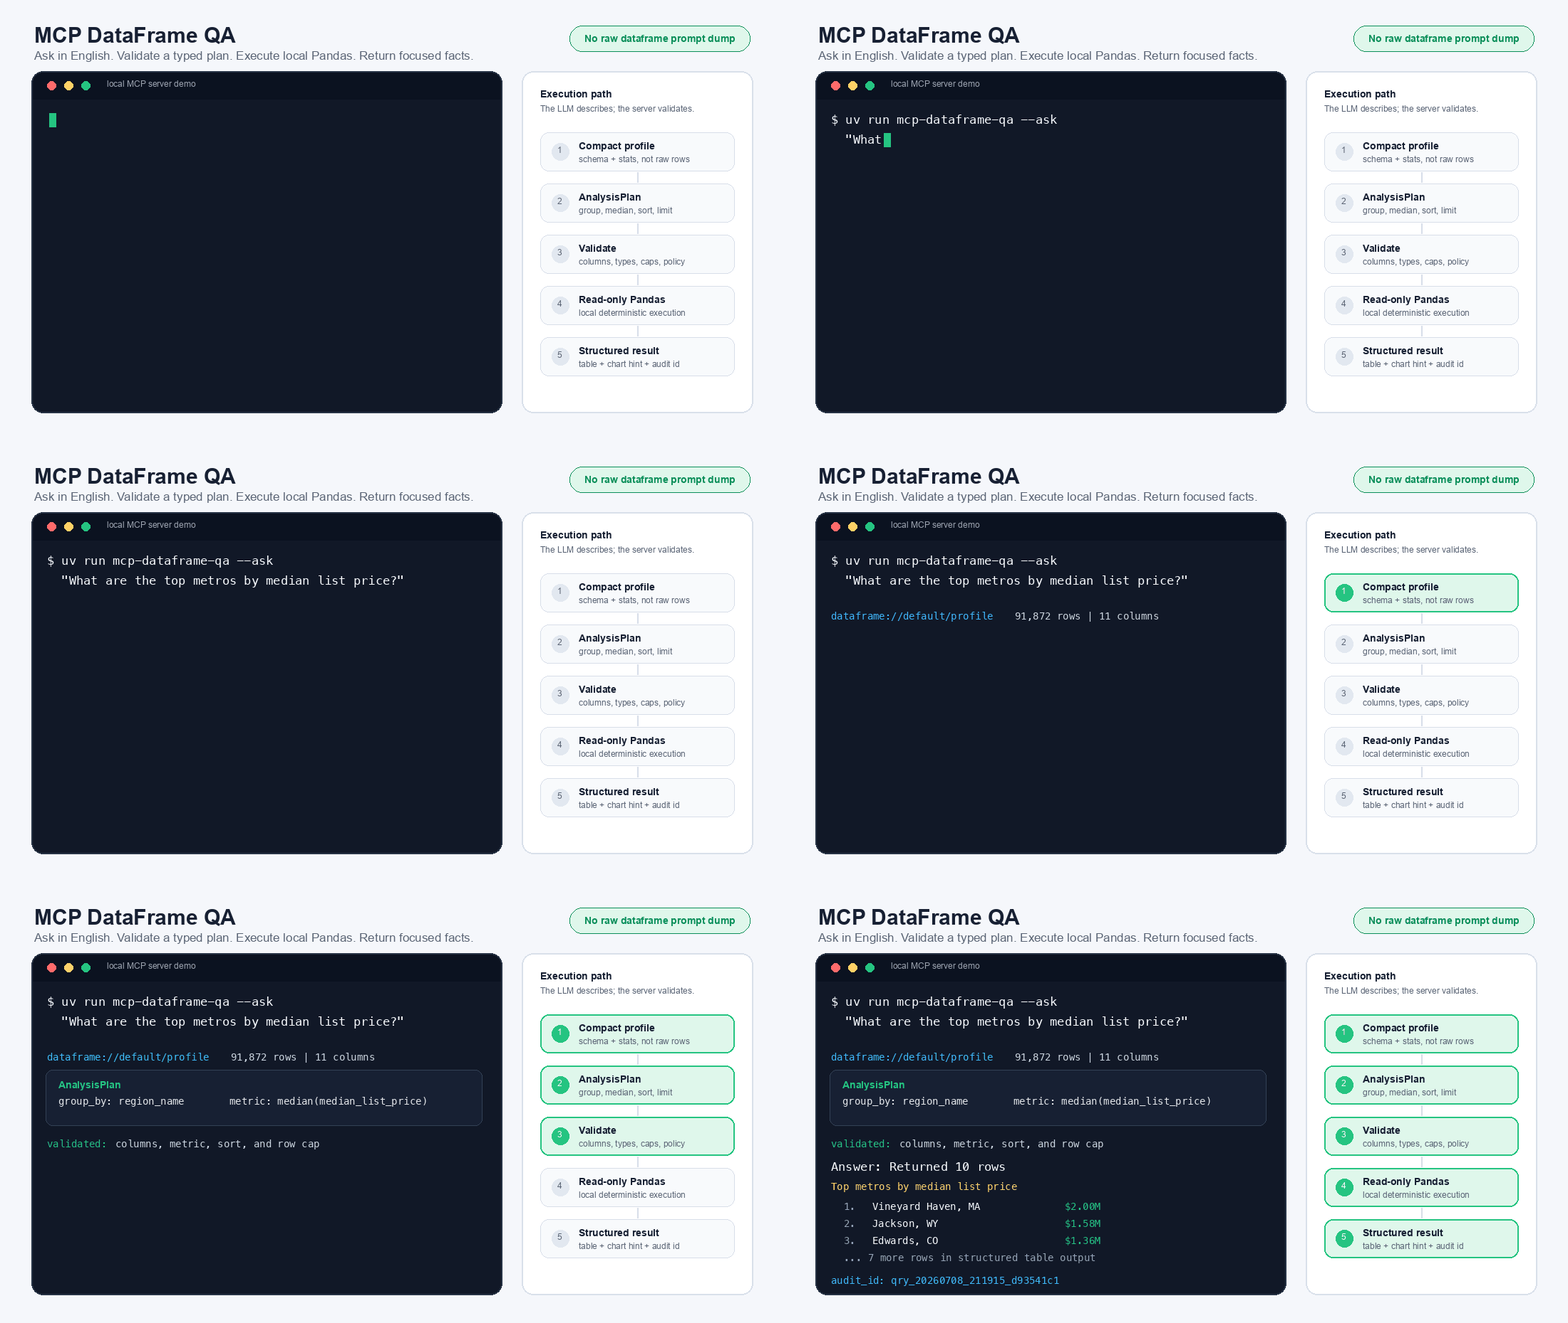
Demo
Highlights
- Bring your own CSV, Parquet file, or Pandas dataframe
- Ask analytical questions in natural language
- Return structured MCP results in addition to prose
- Expose schema through MCP resources instead of placing raw data in prompts
- Use OpenAI, Anthropic, or Gemini to generate typed analysis plans
- Support validated derived measures: arithmetic, comparisons, boolean
and/or/not, date parts and date differences, and Pearson correlation - Explode delimited tag-list columns (
"Action|Adventure") into one row per tag for group-bys - Run a second aggregation pass (
regroup) for "average per period" and "range within group" questions - Surface each grouped row's sample size (
row_count) so a tiny or missing-value group can't silently win a ranking - Draft
--init-configcolumn descriptions with an LLM that reads real sample values, not just column names - Retry once with the validation error when an LLM-generated plan fails schema validation, instead of crashing
- Enforce read-only execution, plan validation, output caps, and cell caps
- Return audit IDs for every query, with optional JSONL audit logs
- Keep the MCP tool surface small, composable, and easy for models to use
Dataset Included
The default dataframe is data/zillow_metro_market.csv, prepared from public Zillow Research Housing Data for-sale listing time series. It combines monthly metro-level and U.S.-level metrics for:
- for-sale inventory
- new listings
- median list price
The prepared table has 91,872 rows, 11 columns, 928 geographies, and month-end observations from 2018-03-31 through 2026-05-31. The CSV is approximately 6.6 MB.
To rebuild the dataset from Zillow Research source CSVs:
python scripts/prepare_zillow_market_data.py
See data/zillow_metro_market.README.md for source URLs, transformation details, and column definitions.
Why This Exists
The DataFrame QA paper demonstrates that language models can answer dataframe questions by generating analytical queries from dataframe structure, while avoiding direct exposure of the full dataset to the model. That observation is the foundation of this project.
A reusable MCP server, however, has additional engineering requirements: explicit tool schemas, client-visible resources, output validation, execution limits, auditability, and safe defaults for users who clone the repository and bring their own data. This project focuses on that implementation layer.
This repository adopts the following approach:
- The assistant sees a compact dataframe profile, not your full dataset.
- Natural language is translated into a typed analysis plan.
- The plan may include derived numeric measures, represented as JSON expression trees rather than Python code.
- The plan is validated against the dataframe schema, type rules, and guardrails.
- A deterministic read-only executor runs the approved dataframe operations.
- Results are returned as structured MCP content plus a concise human-readable answer.
The result is a reusable MCP server for dataframe analytics with explicit production-oriented mechanisms: typed schemas, read-only execution, derived-measure validation, output caps, audit IDs, optional audit logs, and clear MCP resources/tools/prompts. The allowed operations on the dataframe can be modified by the user by adding them to schema.py.
Research Context
This project is motivated by three converging lines of work.
First, dataframe question answering research shows that tabular analysis can be mediated through generated queries rather than full data disclosure. The DataFrame QA framework is particularly relevant because it frames dataframe QA as schema-aware query generation with safe execution.
Second, recent table-QA systems increasingly use multi-stage pipelines: schema understanding, query generation, execution, answer extraction, and refinement. For example, Agentic LLMs for Question Answering over Tabular Data reports a natural-language-to-SQL pipeline with verification and iterative refinement for tabular QA.
Third, MCP literature and practice are converging on small, typed, auditable tool surfaces. MCP Server Architecture Patterns for LLM-Integrated Applications identifies recurring server patterns such as Resource Gateway, Tool Orchestrator, and Domain-Specific Adapter. MCP DataFrame QA is closest to a Domain-Specific Adapter with Resource Gateway behavior: it exposes dataset profiles as resources and analysis operations as a small number of structured tools.
The contribution of this repository is not a new benchmark result. It is a careful systems design for making dataframe QA easy to clone, inspect, run, and adapt within the MCP ecosystem.
Relative to research prototypes and notebook-oriented dataframe agents, this repository emphasizes:
- a packageable MCP server interface
- explicit resources for dataset profiles
- stable input and output schemas
- a typed intermediate analysis representation
- deterministic read-only execution
- local dataframe execution. The only network call in the local chatbot is the selected LLM provider request
- audit records and result-size controls
Quick Start
git clone https://github.com/sindhug/mcp-dataframe-qa.git
cd mcp-dataframe-qa
uv sync
cp .env.example .env
Open .env and set one provider:
LLM_PROVIDER=openai
OPENAI_API_KEY=sk-your-key
Then run the model-backed local chatbot:
uv run mcp-dataframe-chat --question 'What are the top metros by median list price?'
That command launches the MCP server locally over stdio, sends one question through an OpenAI, Anthropic, or Gemini planner, executes the validated plan through MCP, and prints the structured table result.
To start the MCP server for an MCP-compatible client:
uv run mcp-dataframe-qa
You can also verify the local engine before connecting an MCP client:
uv run mcp-dataframe-qa --profile
uv run mcp-dataframe-qa --ask 'What are the top metros by median list price?'
For an interactive chatbot loop:
uv run mcp-dataframe-chat
Or ask one question and exit:
uv run mcp-dataframe-chat --question 'How many metro-months had more than 10,000 active listings?'
For offline development without an LLM key, the deterministic planner remains available:
uv run mcp-dataframe-chat --planner heuristic --question 'What are the top metros by median list price?'
That fallback is useful for testing the executor and MCP plumbing, but the main chatbot path is model-backed.
API Key Configuration
The local chatbot reads .env automatically. Set exactly one provider key:
# .env
LLM_PROVIDER=openai      # openai, anthropic, or gemini

OPENAI_API_KEY=
OPENAI_MODEL=gpt-5.4-mini

ANTHROPIC_API_KEY=
ANTHROPIC_MODEL=claude-sonnet-4-5

GEMINI_API_KEY=
GEMINI_MODEL=gemini-2.5-flash
You can also pass values at runtime:
uv run mcp-dataframe-chat \
  --provider anthropic \
  --model claude-sonnet-4-5 \
  --api-key "$ANTHROPIC_API_KEY"
The dataframe stays local. The model receives the compact dataframe profile,
column metadata, and user question so it can produce an AnalysisPlan; it does
not receive the full CSV.
Example local MCP configuration:
{
  "mcpServers": {
    "dataframe-qa": {
      "command": "uv",
      "args": [
        "run",
        "mcp-dataframe-qa",
        "--data",
        "/absolute/path/to/your/data.csv"
      ]
    }
  }
}
Using Your Own Dataset
There are two ways to point this at your own data. A quick one-off query with no setup, or a configured dataset with column descriptions that make the planner's answers noticeably better. Both start the same way, by looking at what you actually have.
1. Profile the file first.
uv run mcp-dataframe-qa --data ~/Downloads/my_data.csv --profile
This loads the file and prints every column's dtype, null count, summary stats, and top values. No LLM call, no config required. Use it to see what you're working with before writing anything down.
2. Generate a starter config.
uv run mcp-dataframe-qa --data ~/Downloads/my_data.csv --init-config
This writes dataframe_qa_my_data.yaml with every column already listed under its
real name. If an LLM provider is configured (the same .env used everywhere else in
this repo), it sends one batched request with every column's name, dtype, and a
handful of real sample values, and drafts a description, semantic_type, and
synonyms for each column from that. Reading actual values catches things a
name-based guess can't, for example recognizing that a column called Discount holds
a 0-1 fraction rather than a count, that a budget column uses 0 to mean
"not reported" rather than a real zero, or that a genres column packs multiple
values into one string ("Action|Adventure"), in which case it sets
semantic_type: tag_list and a delimiter so the column can be exploded into one
row per tag later. Pass --out <path> to control the filename.
If no provider is configured, --init-config stops with an error telling you to set
one up in .env, or pass --no-llm to fall back to a conservative name-based guess
(a column ending in _id becomes identifier, a column named price becomes
currency, ambiguous numeric columns are left blank rather than mislabeled) with
blank description and synonyms fields.
Either way, treat the generated file as a draft. Open it and correct anything that looks off:
columns:
  status:
    description: Whether the listing is active, pending, or sold
    semantic_type: dimension
    synonyms: [listing status, availability]
3. Use it.
uv run mcp-dataframe-chat --config dataframe_qa_my_data.yaml
uv run mcp-dataframe-qa --config dataframe_qa_my_data.yaml --ask "your question"
If a config's columns and the actual dataframe's columns ever drift apart, a renamed column, a config copied from a different dataset, both tools print a warning naming exactly which columns are affected, instead of silently answering with half the schema missing.
Skipping the config entirely. mcp-dataframe-qa --data <path> works with no
config at all, and is the fastest way to try a file:
uv run mcp-dataframe-qa --data ~/Downloads/my_data.csv --ask "your question"
The tradeoff: with no columns: section, the planner only has column names and raw
sample values to work with, not descriptions or synonyms, so it will sometimes miss
what you mean. mcp-dataframe-chat does not accept --data directly since it always
talks to a specific configured dataset. Point it at a config with --config instead,
even a minimal one with just a dataset: block and no columns: section.
Example of a fully annotated config, the one this repo ships with:
# dataframe_qa.yaml
dataset:
  id: default
  path: data/zillow_metro_market.csv
  table_name: zillow_metro_market

limits:
  max_rows_returned: 100
  max_execution_ms: 3000
  max_cell_chars: 500

columns:
  region_name:
    description: Metro or national region name
    semantic_type: dimension
    synonyms: [metro, market, region, msa]
  state_name:
    description: State abbreviation for the metro area
    semantic_type: dimension
    synonyms: [state, state code]
  for_sale_inventory:
    description: Count of unique listings active at any time during the month
    semantic_type: count
    synonyms: [inventory, active listings, homes for sale]
  median_list_price:
    description: Median listed price in USD
    semantic_type: currency
    synonyms: [median price, list price, asking price, price]
What You Get
Local Chatbot
mcp-dataframe-chat is a terminal chatbot that starts the MCP server over stdio,
reads the dataframe profile from dataframe://default/profile, asks the selected
LLM provider to produce an AnalysisPlan, and executes that plan through the
execute_analysis_plan MCP tool.
Supported providers:
- OpenAI through the Responses API
- Anthropic through the Messages API
- Gemini through the GenerateContent API
MCP Resources
Resources expose dataset context without dumping raw data into the model.
dataframe://default/profile
dataframe://default/columns
dataframe://default/examples
MCP Tools
The public tool surface stays intentionally small.
query_dataframe(question: str, dataset_id: str = "default") -> StructuredResult
execute_analysis_plan(plan: AnalysisPlan, dataset_id: str = "default") -> StructuredResult
preview_dataframe(dataset_id: str = "default", limit: int = 20) -> StructuredResult
query_dataframe is the ergonomic entry point. execute_analysis_plan is the stable core. preview_dataframe is capped and meant for orientation, not data export.
MCP Prompts
Prompts make common workflows discoverable in clients that support them.
ask_dataframe
explain_dataframe
The Core Contract
The DataFrame QA paper studies LLM-generated Pandas queries as a general dataframe QA mechanism. MCP DataFrame QA preserves the central idea of translating natural language into executable analysis, but uses a typed intermediate representation by default.
Instead of executing arbitrary Python, the assistant produces a typed AnalysisPlan. The plan is data, not code: it can describe filters, derived numeric columns, group-bys, metrics, sort order, and limits.
{
  "derive": [],
  "filters": [],
  "group_by": ["region_name"],
  "metrics": [
    {
      "fn": "median",
      "column": "median_list_price",
      "as": "median_list_price"
    }
  ],
  "sort": [
    {
      "column": "median_list_price",
      "direction": "desc"
    }
  ],
  "limit": 10
}
For questions that need custom statistics, the plan can include derived columns. For example, a price-per-square-foot question can be represented as a safe expression tree:
{
  "derive": [
    {
      "name": "price_per_sqft",
      "expr": {
        "op": "divide",
        "left": { "op": "column", "column": "price" },
        "right": { "op": "column", "column": "sqft" }
      }
    }
  ],
  "filters": [],
  "group_by": ["neighborhood"],
  "metrics": [
    {
      "fn": "median",
      "column": "price_per_sqft",
      "as": "median_price_per_sqft"
    }
  ],
  "sort": [
    {
      "column": "median_price_per_sqft",
      "direction": "desc"
    }
  ],
  "limit": 10
}
Rate and proportion questions ("how often does X happen") work the same way: derive a 0/1 indicator column with a comparison, then average it.
{
  "derive": [
    {
      "name": "is_home_win",
      "expr": {
        "op": "==",
        "left": { "op": "column", "column": "game_location" },
        "right": { "op": "literal", "value": "H" }
      }
    }
  ],
  "metrics": [
    {
      "fn": "avg",
      "column": "is_home_win",
      "as": "home_win_rate"
    }
  ]
}
Compound conditions combine with and / or / not (each and/or takes a boolean
left and right, not takes only a left), so a question like "did the favored
team win" can derive (elo_i > opp_elo_i AND result == 'W') OR (elo_i < opp_elo_i AND result == 'L') as one indicator column instead of a single, misleading comparison.
Columns configured with semantic_type: date are parsed to real dates at load time,
so year_of / month_of / day_of_week (each takes a left date column, returns an
integer) and date_diff (takes a left and right date column, returns the
difference in days) can express "which month" or "how many days between two dates."
corr computes the Pearson correlation between two numeric columns instead of just
reporting their separate averages:
{ "metrics": [{ "fn": "corr", "column": "budget", "column2": "revenue", "as": "budget_revenue_corr" }] }
A delimited tag-list column (semantic_type: tag_list, for example genres stored as
"Action|Adventure") can be split into one row per tag before grouping, so "which
genre" groups by individual genre instead of by the whole combination:
{
  "explode": ["genres"],
  "group_by": ["genres"],
  "metrics": [{ "fn": "avg", "column": "vote_average", "as": "avg_rating" }]
}
"Average per period" and "range within group" questions need two aggregation passes:
one to build a per-group-per-period table, then either a coarser aggregation over it
or just a derived column and a ranking. The optional regroup object runs that second
pass over the plan's own group_by output (including its row_count column):
{
  "group_by": ["location", "year"],
  "metrics": [{ "fn": "sum", "column": "rainfall", "as": "yearly_total" }],
  "regroup": {
    "group_by": ["location"],
    "metrics": [{ "fn": "avg", "column": "yearly_total", "as": "avg_annual_rainfall" }],
    "sort": [{ "column": "avg_annual_rainfall", "direction": "desc" }],
    "limit": 1
  }
}
regroup.group_by can also be omitted entirely, for questions that need a derived
column ranked across the first pass's groups without a second, coarser grouping, for
example the biggest single-season swing between a group's own max and min.
The server validates every plan before anything runs:
- columns must exist
- derived columns must have simple, non-conflicting names
- derived expressions may use only approved JSON operators:
column,literal,add,subtract,multiply,divide,ratio, the comparisons==,!=,<,<=,>,>=, the logical combinatorsand,or,not, and the date operatorsyear_of,month_of,day_of_week,date_diff - arithmetic expressions must use numeric operands; comparisons may compare any matching column and literal type;
and/or/notrequire boolean operands (the result of a comparison or anotherand/or/not); date operators require columns withsemantic_type: date explodeonly accepts columns with a configureddelimiterregroup.metricsis required whenregroup.group_byis set, and not allowed otherwise- filter operators and metric functions must be allowed by the schema
- metric functions must be compatible with the referenced column type,
corrrequires two numeric columns - every grouped result includes a
row_countcolumn (unless a metric already claims that name), so a tiny or missing-value group can't win a ranking without that being visible - result limits are enforced
- long string cells are capped
- execution uses deterministic read-only Pandas operations
- no Python source code, imports, filesystem access, or network access are accepted as part of a plan
- every query receives an audit id
- optional JSONL audit logs are written only when configured
- execution time is measured and reported as a warning if it exceeds
max_execution_ms
This plan-based layer is the main engineering adaptation. It makes the generated analysis easier to validate, explain, test, cache, and audit before execution.
Adding Safe Operations
The allowed operations are intentionally explicit. If an analysis operation should be supported, add it to the plan contract and executor instead of asking the LLM to emit raw Pandas code.
Use this path for a new row-level expression operator:
- Add the operation name to
ExpressionOpinsrc/mcp_dataframe_qa/schemas.py. - Add validation rules in
src/mcp_dataframe_qa/validator.py. For numeric binary operations, this usually means adding the operation toBINARY_NUMERIC_OPS. - Add the Pandas implementation in
_evaluate_expressioninsrc/mcp_dataframe_qa/executor.py. - Update the LLM prompt in
src/mcp_dataframe_qa/llm.pyso model-backed planners know the operation exists. - Add guardrail and execution tests in
tests/test_guardrails.py. - Update this README if the operation changes the public plan contract.
For example, to allow a safe power expression:
# src/mcp_dataframe_qa/schemas.py
ExpressionOp = Literal[
    "column",
    "literal",
    "add",
    "subtract",
    "multiply",
    "divide",
    "ratio",
    "power",
]
# src/mcp_dataframe_qa/validator.py
BINARY_NUMERIC_OPS = {"add", "subtract", "multiply", "divide", "ratio", "power"}
# src/mcp_dataframe_qa/executor.py
if expr.op == "power":
    return left**right
Then a planner could request:
{
  "derive": [
    {
      "name": "sqft_squared",
      "expr": {
        "op": "power",
        "left": { "op": "column", "column": "sqft" },
        "right": { "op": "literal", "value": 2 }
      }
    }
  ],
  "metrics": [
    {
      "fn": "avg",
      "column": "sqft_squared",
      "as": "avg_sqft_squared"
    }
  ]
}
For a new aggregate such as std, make the same kind of change in MetricFn, the metric validation rules, _compute_series, _compute_grouped, the LLM prompt, and tests. corr (a metric with a second column2 field) and regroup (a second derive/group_by/metrics/sort/limit pass over the plan's own grouped output) are worked examples of this: rather than squeezing a two-column or two-stage operation into a single string field, each got its own typed shape with its own validation. For rolling windows, joins, or bucketing a continuous value into ranges (a decade from a year, a price tier from a price), the same pattern applies: add a new typed plan node with its own validator and executor handler.
Example structured result:
{
  "answer": "Returned 10 rows. Query: What are the top metros by median list price?",
  "kind": "table",
  "value": null,
  "table": {
    "columns": ["region_name", "row_count", "median_list_price"],
    "rows": [
      {
        "region_name": "Vineyard Haven, MA",
        "row_count": 99,
        "median_list_price": 1997667.0
      }
    ]
  },
  "chart": { "kind": "bar", "x": "region_name", "y": "median_list_price" },
  "warnings": [],
  "audit_id": "qry_20260709_190010_1fa46908"
}
Design Principles
1. Dataframe Profile as Context
The model gets schema, column descriptions, safe samples, and summary statistics. It does not need the full dataframe to answer most analytical questions.
This follows the direction of DataFrame QA research (generate analysis from dataframe structure while minimizing dataset exposure).
2. Typed Plans as Execution Contracts
Generated Pandas remains a valuable research and prototyping technique. For a shareable MCP server, this project uses a typed plan as the default because it provides a narrower execution contract and clearer validation boundary.
The plan can express more than simple aggregates. Derived numeric columns are represented as JSON expression trees and executed by known-safe Pandas handlers. This gives the LLM room to request custom statistics such as ratios without giving it a live Python interpreter.
3. Minimal Tool Surface
MCP servers are easier for models and humans to understand when the tool list is small and composable. This project exposes a few high-leverage tools instead of a tool per dataframe operation.
4. Structured Results First
Every answer returns machine-readable content. The prose is there for humans, but downstream agents and apps should be able to consume the result directly.
5. Safe by Default, Extensible by Choice
The default path is read-only analysis. Advanced code execution, custom functions, remote data loading, and broader filesystem access are extension points rather than default features.
Scope and Limitations
MCP DataFrame QA is designed for practical, local dataframe analysis. It intentionally does not attempt to solve every form of tabular reasoning.
- It is best suited to single-table or lightly configured dataframe workflows.
- It prioritizes deterministic aggregates, filters, sorting, grouping, derived arithmetic/comparison/date measures, correlation, and a bounded two-stage aggregation, not open-ended statistics.
- It does not replace a governed enterprise semantic layer.
- It does not guarantee correct answers for ambiguous business terminology without column descriptions or synonyms.
- It does not expose unrestricted Python execution in the default path.
- It treats charting as a structured output problem, not as a primary visualization framework.
- It does not include a DuckDB execution adapter, arbitrary Python sandbox, or multi-table semantic layer.
These constraints are deliberate. They keep the repository small enough to clone and understand, while leaving room for opt-in extensions.
Guardrails
Guardrails are treated as part of the core interface.
- Read-only dataframe access
- No filesystem writes from the analysis executor
- No network access from the analysis executor
- No arbitrary imports or user code execution in the default path
- Execution-duration warnings through
max_execution_ms - Row, cell, and payload-size caps
- Query validation before execution
- Output sanitization
- Audit IDs for every query and optional JSONL audit logs
- Pydantic schemas for plans and structured results
- A malformed LLM-generated plan is retried once with the validation error, then reported as a clean error, instead of crashing the process
The default server runs local, read-only dataframe analysis with explicit validation and capped outputs.
Architecture
User question
    |
    v
Local chatbot or MCP-compatible client
    |
    v
Dataframe profile resource
    |
    v
LLM planner or built-in heuristic planner
    |
    v
AnalysisPlan
    |
    v
Validator: schema, types, limits, policy
    |
    v
Executor: read-only Pandas DataFrame engine
    |
    v
StructuredResult: answer, value/table/chart, audit id
Implemented package layout:
src/mcp_dataframe_qa/
  cli.py             # command-line entrypoint and MCP server launcher
  chatbot.py         # model-backed local stdio chatbot
  llm.py             # OpenAI, Anthropic, and Gemini planning clients
  server.py          # MCP resources, tools, prompts
  config.py          # YAML configuration models and loader
  datasets.py        # dataset registry and loaders
  profiling.py       # schema, stats, safe examples
  planner.py         # question -> AnalysisPlan
  schemas.py         # Pydantic plans, expressions, and results
  validator.py       # guardrails, type rules, and policy checks
  executor.py        # read-only DataFrame execution
  audit.py           # audit records
Example Questions
Bundled Zillow Research dataset:
- "What are the top metros by median list price?"
- "Show average median list price by state."
- "How many metro-months had more than 10,000 active listings?"
- "Show average for-sale inventory by state."
- "What are the top markets by new listings?"
- "How many rows have median list price over $1M?"
- "Which markets have the highest new-listings-to-inventory ratio?"
Small listing fixture used by the tests:
- "How many homes are under $750k?"
- "Show average price by bedroom count."
- "How many listings have at least 3 bedrooms and 2 bathrooms?"
- "What are the top ZIP codes by median price?"
- "Which neighborhoods have the highest median price per square foot?"
Bring your own dataframe works best when questions map to the implemented operations: counts, filters, group-bys, aggregate metrics (including correlation), derived arithmetic/comparison/date measures, tag-list exploding, two-stage aggregation, sorting, limits, and capped previews.
When to Use This
Use MCP DataFrame QA when:
- you have one dataframe or a small set of local tabular files
- you want natural-language analytics inside an MCP-compatible assistant
- you care about privacy, auditability, and predictable execution
- you want a reusable adapter instead of a one-off notebook
Do not use it as a replacement for:
- a full semantic BI layer
- governed enterprise data warehouses
- multi-tenant production analytics without additional authorization
- unrestricted Python notebooks
Implemented
- CSV and JSON loading
- Parquet loading through Pandas when a Parquet engine is installed
- Bundled public Zillow Research housing-market dataframe
- Reproducible Zillow dataset preparation script
.env-based API key configuration through.env.example- Model-backed local chatbot for OpenAI, Anthropic, and Gemini
- Configurable column descriptions, semantic types, and synonyms
- Dataset profiling with capped examples
- Pydantic
AnalysisPlanschemas - Validated derived expressions: arithmetic, comparisons, boolean
and/or/not, and date parts/differences - Date columns parsed to real datetime64 at load when configured with
semantic_type: date corrmetric for Pearson correlation between two numeric columnsexplodefor delimiter-separated tag-list columns, scoped to a single plan rather than a permanent load-time transformregroupfor a second aggregation pass over a plan's own grouped outputrow_countincluded in every grouped result so small or missing-value groups are visible, not just silently ranked- LLM-assisted
--init-configscaffolding that drafts descriptions, semantic types, and delimiters from real sample values, with a name-based heuristic fallback - Conservative built-in natural-language planner for offline fallback testing
- Read-only Pandas-backed execution
- MCP resources for profiles, columns, and capped examples
- MCP tools with structured result payloads
- Local terminal chatbot that verifies the MCP stdio path
- Audit IDs and optional JSONL audit log sink
- Test coverage for common real-estate questions, guardrails, derived expressions, correlation, explode, regroup, date handling, scaffolding, and the mocked LLM planner
Not Yet Built
- No DuckDB execution adapter.
- No arbitrary Pandas code sandbox.
- No unrestricted custom Python statistics in the default path.
- No multi-table joins or governed semantic layer.
- No benchmark-quality table-QA evaluation suite.
- No enterprise authorization model or multi-tenant deployment layer.
- No hard process-level timeout around Pandas execution; execution duration is measured and reported as a warning.
- No operator for bucketing a continuous value into ranges (a decade from a year, a price tier from a price); this currently has to be worked around and is easy for a planner to get wrong.
Known Failure Modes
These are not hypothetical gaps. Each was reproduced against real public datasets (retail transactions, restaurant inspections, movie metadata, weather records, NBA game history) while developing this project, so they are documented plainly instead of left implicit in "Not Yet Built."
- Bucketing a continuous value into ranges. "How has average runtime changed by
decade?" or "average points per game by decade" has no
floor_div/modoperator to reach for, so the planner improvises withdivide/multiplyand gets the arithmetic wrong, producing meaningless fractional buckets (1751.40,1755.90) instead of real decades. There is no clean error here, just a wrong-looking table. - Compound "which group is highest, and does it relate to Y" questions. "Which
region has the highest average discount, and does it correlate with lower profit
margins?" reliably answers the first half but not the second: the planner tends to
show only the top region's own numbers rather than computing an actual correlation
across all regions with
corr. Asking the correlation on its own ("is X correlated with Y?") is answered correctly and reliably; it's the compound phrasing that gets dropped. - A grouped result's
row_countreflects the group's size, not how many rows fed a specific metric. A category with 300 rows but only 2 non-null values in the column being averaged still showsrow_count: 300, which can still read as statistically solid even though the average behind it is not. - Ambiguous "swing" or "range" questions. A question like "which locations see the
most extreme temperature swings" can mean a swing within a single row (today's max
minus today's min) or a swing across a whole group (the location's all-time max
minus all-time min). The planner sometimes picks one, sometimes the other, and when
it reaches for the harder, cross-group interpretation it can confuse a plan's
pre-aggregation
derivewithregroup's post-aggregationderive, referencing a metric's output name where a raw column is expected. This fails with a clean validation error, not a crash, but does not answer the question. - A malformed LLM-generated plan can still crash in rare cases. The one correction retry (see Guardrails) resolves most invalid plans, but if the model produces invalid JSON shape on both the original attempt and the retry, the process can still raise an unhandled error instead of a clean one.
- No multi-table questions. Anything that needs joining two files ("which customers in table A also appear in table B") is out of scope entirely; only one configured dataframe is queried at a time.
- Ambiguous business terms with no column description. If a config's
columns:section is empty or a column has nodescription/synonyms, a term like "revenue" may not connect to a column literally namedSales. This is why--init-configexists and why annotating the generated config matters.
Contributing
This project is intentionally small and opinionated. Good contributions usually make it easier to trust, install, test, or adapt:
- new dataframe loaders
- stronger plan validation
- more safe expression operators and aggregate functions
- better profiling and semantic column hints
- more evaluation questions
- clearer MCP client examples
- safer execution limits
- sharper documentation
The guiding rule: keep the default path simple, read-only, predictable, and reliable.
Standards and References
This project is shaped by current MCP and table-QA patterns:
- Model Context Protocol specification
- MCP tools: structured content and output schemas
- MCP resources
- MCP security best practices
- OpenAI Responses API
- Anthropic Messages API
- Gemini GenerateContent API
- Zillow Research Housing Data
- DataFrame QA: A Universal LLM Framework on DataFrame Question Answering Without Data Exposure
- MCP Server Architecture Patterns for LLM-Integrated Applications
- Model Context Protocol Threat Modeling and Tool Poisoning Analysis
Philosophy
The intended user experience is deliberately simple:
- Drop in a file.
- Start the MCP server.
- Ask a question.
- Get a structured, capped, auditable result.
The project aims to provide a small, inspectable adapter between a dataframe and the assistant a user already uses.
License
MIT
Установка DataFrame QA
У этого сервера нет опубликованного пакета — он собирается из исходников. Открой репозиторий и следуй инструкции в README.
▸ github.com/sindhug/mcp-dataframe-qaFAQ
DataFrame QA MCP бесплатный?
Да, DataFrame QA MCP бесплатный — установка в пару кликов через Unyly без оплаты.
Нужен ли API-ключ для DataFrame QA?
Нет, DataFrame QA работает без API-ключей и переменных окружения.
DataFrame QA — hosted или self-hosted?
Self-hosted: сервер запускается локально на твоей машине командой из раздела установки.
Как установить DataFrame QA в Claude Desktop, Claude Code или Cursor?
Открой DataFrame QA на unyly.org, выбери вкладку своего клиента (Claude Desktop, Claude Code, Cursor) и нажми Install — конфиг сгенерируется автоматически, без правки JSON.
Похожие MCP
GitHub
PRs, issues, code search, CI status
 автор: GitHub
Filesystem
Secure file operations with configurable access controls.
Memory
Knowledge graph-based persistent memory system.
Template MCP Server
A CLI tool to create a new Model Context Protocol server project with TypeScript support, dual transport options, and an extensible structure
 автор: mcpdotdirect
Compare DataFrame QA with
Не уверен что выбрать?
Найди свой стек за 60 секунд
Автор?
Embed-бейдж для README
Похожее
Все в категории development