
Polybugger
БесплатноНе проверенMulti-language MCP debugger for AI agents that supports Python, JavaScript/TypeScript, Go, Rust, and C/C++ with features like container debugging, session recov

Описание
Multi-language MCP debugger for AI agents that supports Python, JavaScript/TypeScript, Go, Rust, and C/C++ with features like container debugging, session recovery, and watch expressions.
README
PyPI version License: MIT Tests Python 3.10+
Multi-language MCP debugger for AI agents. Debug Python, JavaScript/TypeScript, Go, and Rust with a single tool.
Install in Cursor Install in VS Code
Supported Languages
| Language | Debugger | Status |
|---|---|---|
| Python | debugpy (VS Code) | Stable |
| JavaScript/TypeScript | Node.js Debug Adapter | Stable |
| Go | Delve | Stable |
| Rust | CodeLLDB | Stable |
| C/C++ | CodeLLDB | Stable |
Demo
AI Debugging a Crashing Script
The AI uses polybugger to find a division-by-zero bug in a Python script:

Available Debug Tools

Session Continuity
Debug sessions persist across multiple interactions - no need to reconfigure breakpoints or restart:
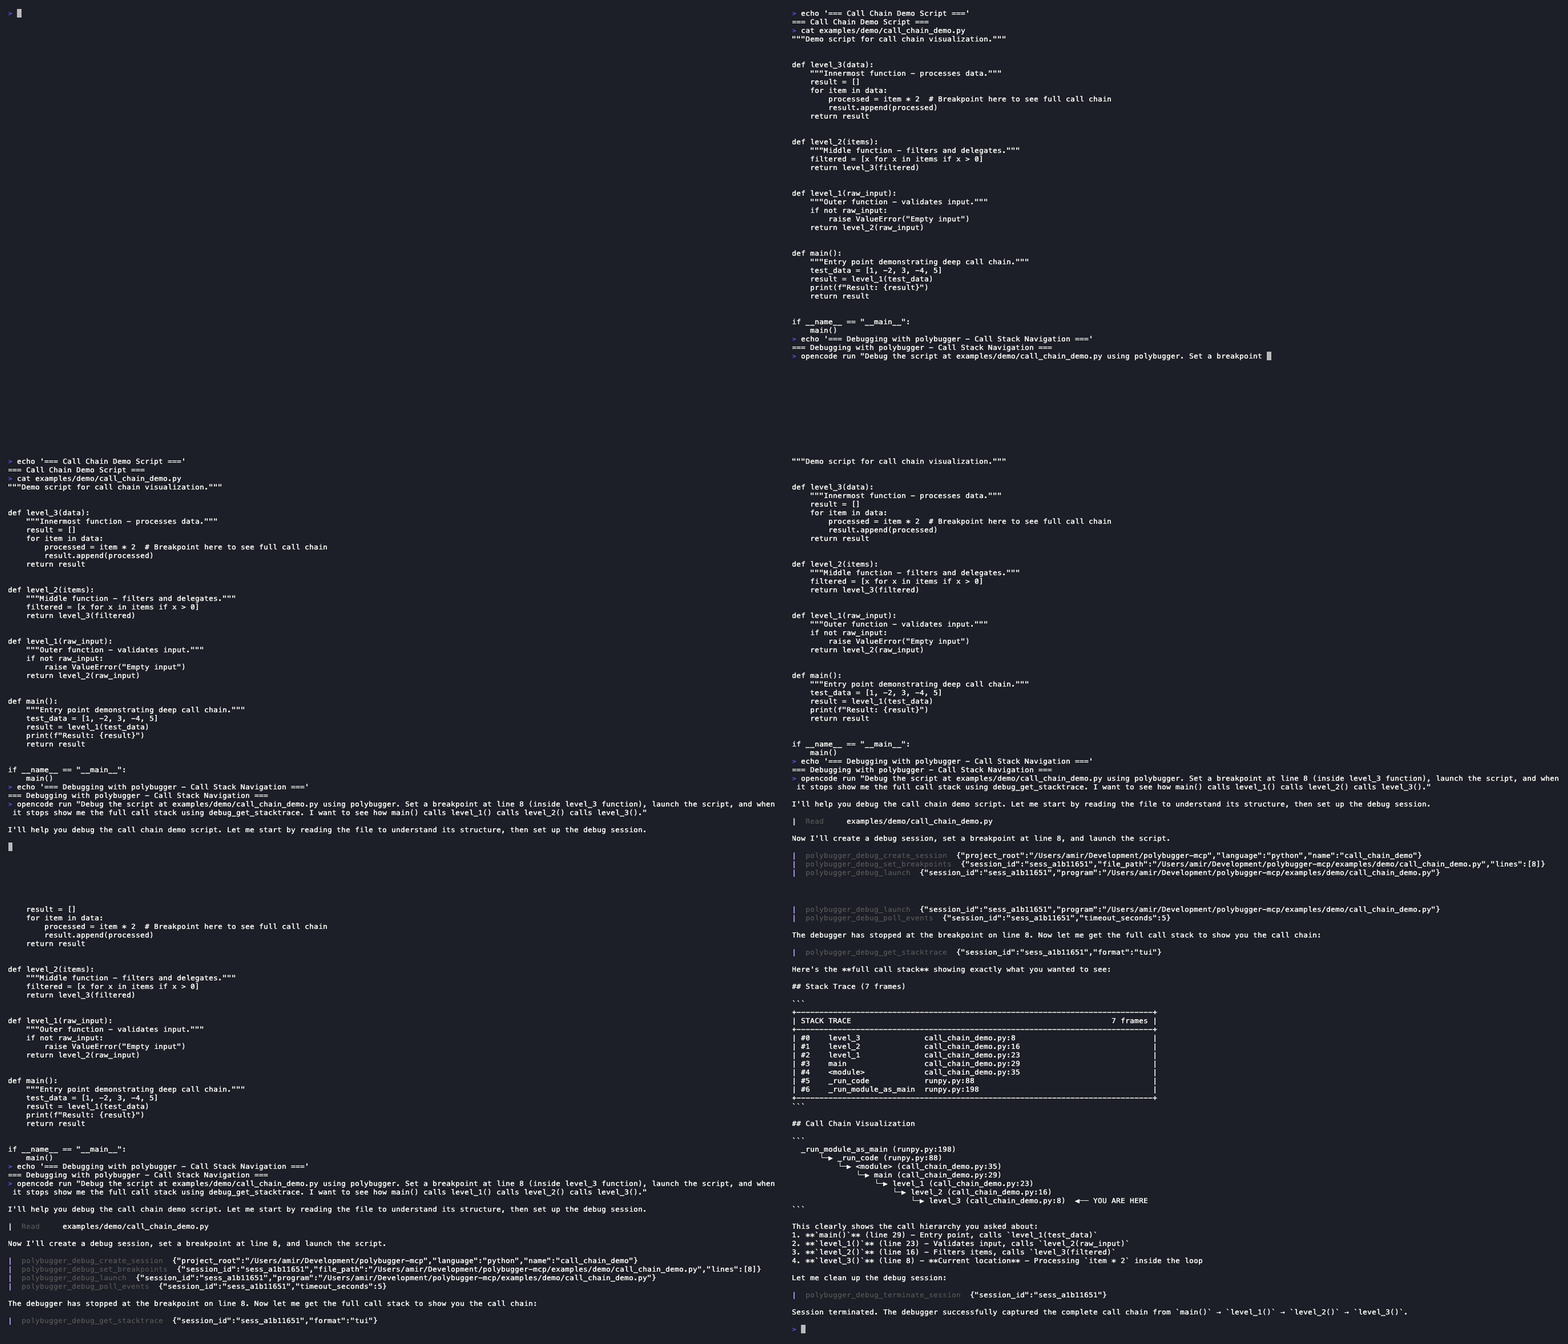
Call Chain Visualization
See the complete call stack with source context at each frame:
Watch Expressions
Track variable values as they change through execution:
Why polybugger-mcp?
| Feature | polybugger-mcp | Other MCP debuggers |
|---|---|---|
| Multi-Language | Python, JS/TS, Go, Rust, C/C++ | Python only |
| Container Debugging | Docker, Podman, Kubernetes | Not available |
| Session Recovery | Resume debugging after server restart | Not available |
| Watch Expressions | Track values across debug steps | Planned for 2026 |
| Pure Python | Single pip install, no Node.js |
Requires Node.js runtime |
| HTTP API | Use independently of MCP | MCP-only |
Key Features
- Multi-Language Debugging - Python, JavaScript/TypeScript, Go, Rust, and C/C++
- Container Debugging - Debug processes inside Docker, Podman, and Kubernetes
- Session Recovery - Persist debug state and resume after server restart
- Watch Expressions - Define expressions to track across every debug step
- Smart Data Inspection - Intelligent preview of DataFrames, NumPy arrays, dicts, and lists
- Call Hierarchy - Visualize the complete call chain with source context
- Full Interactive Debugging - Breakpoints, stepping, pause/continue
- Variable Inspection - View locals, globals, evaluate arbitrary expressions
- Rich TUI Output - ASCII box-drawn tables and diagrams for better visualization
- Pure Python - No Node.js required, just
pip install - Dual Interface - Use via MCP or standalone HTTP API
- Multi-Client Support - Cursor, VS Code, Claude Desktop, and more
Installation
Quick Install (no clone required)
Using uvx (recommended):
uvx polybugger-mcp
Using pipx:
pipx run polybugger-mcp
Using pip:
pip install polybugger-mcp
polybugger-mcp
MCP Client Configuration
Configure your MCP client to use one of these commands:
Cursor
Add to ~/.cursor/mcp.json:
{
  "mcpServers": {
    "polybugger": {
      "command": "uvx",
      "args": ["polybugger-mcp"]
    }
  }
}
Alternative: using pip install
{
  "mcpServers": {
    "polybugger": {
      "command": "python",
      "args": ["-m", "polybugger_mcp.mcp_server"]
    }
  }
}
VS Code
Use the VS Code CLI:
code --add-mcp '{"name":"polybugger","command":"uvx","args":["polybugger-mcp"]}'
Or add to your MCP settings manually.
Claude Code
claude mcp add polybugger -- uvx polybugger-mcp
Claude Desktop
Add to your Claude Desktop config (~/Library/Application Support/Claude/claude_desktop_config.json on macOS):
{
  "mcpServers": {
    "polybugger": {
      "command": "uvx",
      "args": ["polybugger-mcp"]
    }
  }
}
OpenCode
Add to ~/.config/opencode/opencode.json:
{
  "mcp": {
    "polybugger": {
      "type": "local",
      "command": ["uvx", "polybugger-mcp"],
      "enabled": true
    }
  }
}
Windsurf
Add to your Windsurf MCP config:
{
  "mcpServers": {
    "polybugger": {
      "command": "uvx",
      "args": ["polybugger-mcp"]
    }
  }
}
Cline
Add to your cline_mcp_settings.json:
{
  "mcpServers": {
    "polybugger": {
      "command": "uvx",
      "args": ["polybugger-mcp"],
      "disabled": false
    }
  }
}
Goose
Go to Settings > Extensions > Add custom extension:
- Type: STDIO
- Command:
uvx polybugger-mcp
Docker
docker run -i --rm ghcr.io/wilfoa/polybugger-mcp
Or in your MCP config:
{
  "mcpServers": {
    "polybugger": {
      "command": "docker",
      "args": ["run", "-i", "--rm", "ghcr.io/wilfoa/polybugger-mcp"]
    }
  }
}
Available Tools (28 tools)
Session Management
| Tool | Description |
|---|---|
debug_create_session |
Create a new debug session (supports language parameter) |
debug_list_sessions |
List all active debug sessions |
debug_get_session |
Get detailed session information |
debug_terminate_session |
End a debug session and clean up |
debug_list_languages |
List supported programming languages |
Breakpoints
| Tool | Description |
|---|---|
debug_set_breakpoints |
Set breakpoints in source files (with optional conditions) |
debug_get_breakpoints |
List all breakpoints for a session |
debug_clear_breakpoints |
Remove breakpoints from files |
Execution Control
| Tool | Description |
|---|---|
debug_launch |
Launch a program for debugging |
debug_continue |
Continue execution until next breakpoint |
debug_step |
Step execution: mode="over" (next line), "into" (enter function), "out" (exit function) |
debug_pause |
Pause a running program |
debug_attach |
Attach to a running debugpy server |
Inspection
| Tool | Description |
|---|---|
debug_get_stacktrace |
Get the current call stack (supports TUI format) |
debug_get_scopes |
Get variable scopes (locals, globals) |
debug_get_variables |
Get variables in a scope (supports TUI format) |
debug_evaluate |
Evaluate an expression in the current context |
debug_inspect_variable |
Smart inspection of DataFrames, arrays, dicts with metadata |
debug_get_call_chain |
Call hierarchy with source context for each frame |
Watch Expressions
| Tool | Description |
|---|---|
debug_watch |
Manage watches: action="add", "remove", or "list" |
debug_evaluate_watches |
Evaluate all watch expressions |
Events & Output
| Tool | Description |
|---|---|
debug_poll_events |
Poll for debug events (stopped, terminated, etc.) |
debug_get_output |
Get program stdout/stderr |
Recovery
| Tool | Description |
|---|---|
debug_list_recoverable |
List sessions that can be recovered |
debug_recover_session |
Recover a session from previous server run |
Container Debugging
| Tool | Description |
|---|---|
debug_container_list_processes |
List Python processes in a container |
debug_container_attach |
Attach to a process in a container (auto-injects debugpy) |
debug_container_launch |
Launch a program with debugging in a container |
Quick Start
Install the package:
pip install polybugger-mcpConfigure your MCP client (see Installation above)
Start debugging: Ask your AI assistant:
"Debug my script.py - set a breakpoint on line 15 and show me the variables when it stops"
Example Workflows
Basic Debugging
You: Debug tests/test_example.py - I want to see why the calculate function returns wrong results

AI: I'll create a debug session and set breakpoints in the calculate function.
    [Creates session, sets breakpoints, launches program]

    The program stopped at line 23. Here are the local variables:
    - x = 10
    - y = 5
    - result = 50  # This should be 15!

    I see the issue - you're using multiplication instead of addition on line 24.
Data Science Debugging
You: Debug my data pipeline and inspect the DataFrame at line 45

AI: [Sets breakpoint, launches program]

    The DataFrame `df` has 1000 rows x 5 columns (78.1 KB):

    ┌────────────┬────────────────┬────────┐
    │ Name       │ Type           │ Nulls  │
    ├────────────┼────────────────┼────────┤
    │ id         │ int64          │ -      │
    │ name       │ object         │ 5      │
    │ value      │ float64        │ 12     │
    └────────────┴────────────────┴────────┘

    I found 17 null values. The `value` column has NaN entries that may cause issues.
Call Hierarchy Visualization
You: Show me how we got to this breakpoint

AI: [Uses debug_get_call_chain with format="tui"]

    CALL CHAIN (4 frames)
    ════════════════════════════════════════════════════════════

    main (app.py:50)
    │ >> 50 │     result = process_order(order)
    │
    └─▶ process_order (orders.py:76)
        │ >> 76 │     pricing = apply_pricing(items, tier)
        │
        └─▶ apply_pricing (pricing.py:58)
            │ >> 58 │     discount = calculate_discount(subtotal)
            │
            └─▶ calculate_discount (pricing.py:23)  ◀── YOU ARE HERE
                │ >> 23 │     return base * rate
Container Debugging
You: Debug the Python process running in my Docker container "api-server"

AI: I'll list the Python processes in that container and attach the debugger.
    [Lists processes, finds PID 1234, injects debugpy, attaches]

    Successfully attached to process 1234 in container "api-server".
    The program is paused at the entry point. Here's the current state:
    - File: /app/server.py
    - Function: handle_request
    - Line: 45

    I can see the request object contains invalid JSON. The 'data' field is None.
Multi-Language Debugging
You: Debug my Go server - it's crashing on startup

AI: I'll create a Go debug session using Delve.
    [Creates session with language="go", sets breakpoints, launches]

    The program stopped at main.go:23. The config variable is nil
    because the environment variable CONFIG_PATH is not set.
Configuration
Environment variables (prefix with PYBUGGER_MCP_):
| Variable | Default | Description |
|---|---|---|
HOST |
127.0.0.1 |
Server bind address |
PORT |
5679 |
Server port (for HTTP mode) |
MAX_SESSIONS |
10 |
Maximum concurrent debug sessions |
SESSION_TIMEOUT_SECONDS |
3600 |
Session idle timeout (1 hour) |
DATA_DIR |
~/.polybugger-mcp |
Data directory for persistence |
LOG_LEVEL |
INFO |
Logging level |
Development
# Clone and setup
git clone https://github.com/wilfoa/polybugger-mcp.git
cd polybugger-mcp
python -m venv .venv
source .venv/bin/activate
pip install -e ".[dev]"

# Run tests
make test

# Run linter
make lint

# Run type checker
make typecheck
Recording Demo GIFs
Demo GIFs are created using VHS with OpenCode as the MCP client. To regenerate them:
# Install VHS
brew install charmbracelet/tap/vhs

# Configure OpenCode with polybugger MCP (in ~/.config/opencode/opencode.json)
# Add: "mcp": { "polybugger": { "type": "local", "command": ["uvx", "polybugger-mcp"], "enabled": true } }

# Generate the GIFs
vhs docs/tapes/debug_demo.tape              # Shows available debug tools
vhs docs/tapes/debug_full_demo.tape         # Full debugging workflow
vhs docs/tapes/session_continuity_demo.tape # Session persistence across interactions
vhs docs/tapes/call_chain_demo.tape         # Call stack visualization
vhs docs/tapes/watch_expressions_demo.tape  # Watch expressions feature
vhs docs/tapes/container_debug_demo.tape    # Container debugging
Architecture
                              ┌─────────────────┐
                              │  debugpy        │──▶ Python
                              ├─────────────────┤
AI Agent  ◀──▶  MCP Server  ◀─┤  Node Debug     │──▶ JavaScript/TypeScript
                              ├─────────────────┤
                              │  Delve          │──▶ Go
                              ├─────────────────┤
                              │  CodeLLDB       │──▶ Rust/C/C++
                              └─────────────────┘
                                     │
                              ┌──────┴──────┐
                              │  Container  │
                              │  Runtimes   │
                              ├─────────────┤
                              │ Docker      │
                              │ Podman      │
                              │ Kubernetes  │
                              └─────────────┘
The MCP server translates tool calls to Debug Adapter Protocol (DAP) messages for each language's debugger, enabling full debugging capabilities through natural language.
Requirements
- Python 3.10 or higher
- Works on macOS, Linux, and Windows
Contributing
Contributions are welcome! Please see CONTRIBUTING.md for guidelines.
License
MIT License - see LICENSE for details.
Установка Polybugger
У этого сервера нет опубликованного пакета — он собирается из исходников. Открой репозиторий и следуй инструкции в README.
▸ github.com/wilfoa/polybugger-mcpFAQ
Polybugger MCP бесплатный?
Да, Polybugger MCP бесплатный — установка в пару кликов через Unyly без оплаты.
Нужен ли API-ключ для Polybugger?
Нет, Polybugger работает без API-ключей и переменных окружения.
Polybugger — hosted или self-hosted?
Self-hosted: сервер запускается локально на твоей машине командой из раздела установки.
Как установить Polybugger в Claude Desktop, Claude Code или Cursor?
Открой Polybugger на unyly.org, выбери вкладку своего клиента (Claude Desktop, Claude Code, Cursor) и нажми Install — конфиг сгенерируется автоматически, без правки JSON.
Похожие MCP
Fetch
Web content fetching and conversion for efficient LLM usage.
AWS KB Retrieval
Retrieval from AWS Knowledge Base using Bedrock Agent Runtime.
 автор: modelcontextprotocol
Spring AI MCP Server
Provides auto-configuration for setting up an MCP server in Spring Boot applications.
llm-analysis-assistant
A very streamlined mcp client that supports calling and monitoring stdio/sse/streamableHttp, and can also view request responses through the /logs page. It also
 автор: xuzexin-hz
Compare Polybugger with
Не уверен что выбрать?
Найди свой стек за 60 секунд
Автор?
Embed-бейдж для README
Похожее
Все в категории ai