
Serbian Data
БесплатноНе проверенEnables searching and analyzing over 3,400 datasets from the Serbian government open data portal, with built-in charting and data transformation tools.

Описание
Enables searching and analyzing over 3,400 datasets from the Serbian government open data portal, with built-in charting and data transformation tools.
README
PyPI - Version Python - Version License: MIT Smithery
MCP server for accessing Serbian open data portal (data.gov.rs) with built-in visualization, storytelling, and analytics capabilities.
pip install serbian-data-mcp
Features
Data Access
- 🔍 Search 3,400+ datasets from Serbian government (data.gov.rs)
- 📥 Download data in JSON, CSV, XML, XLSX formats
- 🇷🇸 Full Serbian language support (UTF-8)
- 🚀 Built-in rate limiting and caching
Visualization — 15+ Chart Types
- 📊 Basic charts: line, bar, pie, scatter, histogram, box plot
- 🗺️ Maps: choropleth (25 Serbian districts), bubble map, multi-layer map
- 📈 Data journalism: slope chart, waffle chart, population pyramid, sankey diagram, radar chart
- 🎯 Advanced: heatmap, treemap, gauge/donut, funnel, sparklines, animated timelines
- ✨ Special: arrow chart, dumbbell chart, lollipop chart
Storytelling & Analytics
- 📰 Infographics: big number cards, auto-generated insights, timeline ribbon, data tables
- 📊 Dashboards: multi-panel layouts with mixed chart types
- 📜 Scrollytelling: scroll-driven HTML stories with IntersectionObserver
- 📈 Forecasting: linear/exponential projections with R² and growth rates
- 🏆 Benchmarking: compare against EU averages or custom references
- 🔍 Cross-dataset analysis: correlations, outliers, rank divergences
Export & Sharing
- 🌐 HTML: styled, responsive pages with dark data-journalism aesthetic
- 🖼️ PNG/PDF: export with kaleido (graceful fallback if not installed)
- 📎 Embed: iframe embed code for websites/blogs
- 📋 JSON: raw Plotly spec for custom integration
Data Tools
- 🔧 Transformation tools: filter, group, aggregate, sort, select
- 📋 Auto-extracted insights: extremes, temporal changes, rankings, outliers
- 💬 Auto-generated narrative summaries
- 🔧 Git repository visualization and analysis
🚀 Quick Start
Install from PyPI (Recommended)
pip install serbian-data-mcp
Then add to your MCP client configuration (see Usage below).
Install from Smithery
Smithery is a registry and CLI for discovering and installing MCP servers.
# Install the Smithery CLI
npm install -g smithery@latest

# Add to Claude Desktop
smithery mcp add acailic/serbian-data-mcp --client claude

# Add to Cursor
smithery mcp add acailic/serbian-data-mcp --client cursor

# Or connect as a remote Smithery connection
smithery mcp add acailic/serbian-data-mcp --id serbian-data
Note: Requires Node.js 20+. After adding, restart your AI client for changes to take effect.
Install from Source
git clone https://github.com/acailic/serbian-data-mcp
cd serbian-data-mcp
uv sync
📖 Configuration
The server works out of the box with sensible defaults. To customize, create a config.json in your working directory (or next to the installed package):
{
  "api_base": "https://data.gov.rs",
  "rate_limit": 1.0,
  "timeout": 30,
  "cache_dir": ".cache",
  "export_dir": "exports"
}
See config.example.json in the source repo for all options.
🚀 Usage
Claude Desktop Configuration
{
  "mcpServers": {
    "serbian-data": {
      "command": "serbian-data-mcp"
    }
  }
}
Or if you installed from source:
{
  "mcpServers": {
    "serbian-data": {
      "command": "python",
      "args": ["-m", "serbian_data_mcp"]
    }
  }
}
Via Smithery CLI
If you installed via Smithery, the configuration is handled automatically. Just run:
# For Claude Desktop
smithery mcp add acailic/serbian-data-mcp --client claude

# For Cursor
smithery mcp add acailic/serbian-data-mcp --client cursor
Then restart your AI client. No manual config editing needed.
📊 Visualization Gallery
All charts feature a polished dark data-journalism theme with Inter font, refined hover styles, and consistent Serbian flag color palette. Three themes available: dark, light, and infographic.
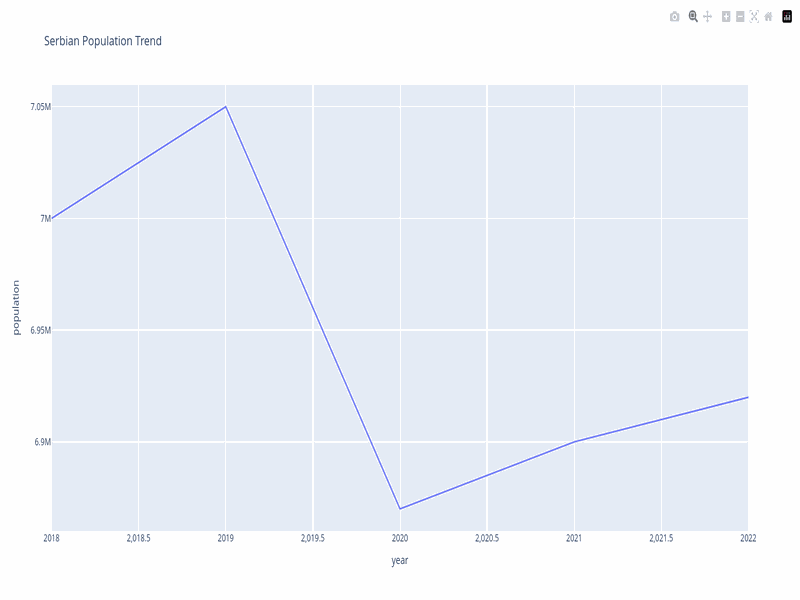
Line Charts — Time Series & Trends
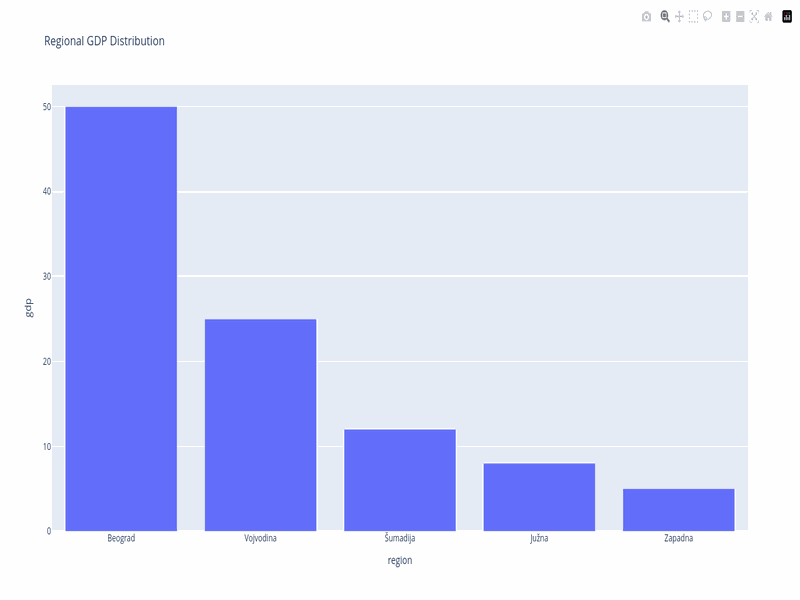
Bar Charts — Comparisons & Rankings
Choropleth Map — Serbian Districts
Interactive map of 25 Serbian districts with Cyrillic/Latin name resolution, available as choropleth or bubble map.
Population Pyramid — Demographics

Slope Chart — Ranking Changes
Shows how district rankings shifted between censuses (2002 → 2022), with green for gainers and red for losers.
Sankey Diagram — Budget Flows
Visualize budget flows from revenue sources through ministries to spending categories.
Radar Chart — Multi-Metric Comparison
Compare cities across population, GDP per capita, schools, hospitals, and parks on a single spider plot.
Waffle Chart — Proportional Data
"1 in 4 Serbs live in Belgrade" — each category gets a block of squares in a 10×10 grid.
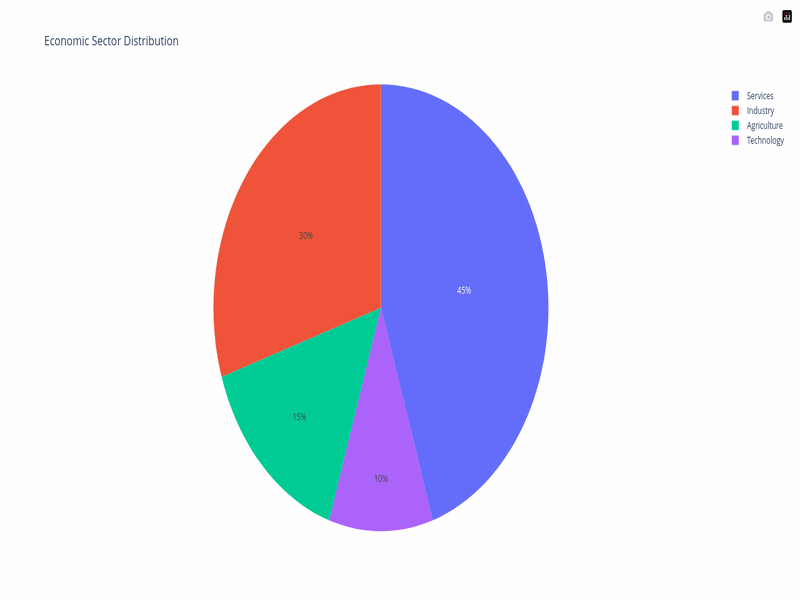
Donut Charts — Sector Distribution
Infographics — Data Stories
Auto-generated single-page stories with big number cards, timeline ribbon, insights, and supporting charts.
Dashboards — Multi-Panel Views
Combine multiple chart types into a single dashboard layout with big number KPIs.
Scrollytelling — Scroll-Driven Stories
Interactive HTML stories that reveal data as the user scrolls, with IntersectionObserver animations.
Examples
Search & Visualize
# Search datasets
datasets = await mcp.call_tool("search_datasets", {
    "query": "population",
    "format": "json",
    "page_size": 10
})

# Create a basic chart
chart = await mcp.call_tool("create_visualization", {
    "data": data,
    "chart_type": "line",
    "title": "Population Trends",
    "x_column": "year",
    "y_column": "population",
})

# Create an advanced chart (slope chart for census changes)
slope = await mcp.call_tool("create_slope_chart", {
    "data": census_data,
    "entity_column": "district",
    "start_column": "pop_2002",
    "end_column": "pop_2022",
    "title": "Census Ranking Changes 2002→2022"
})
Forecast & Benchmark
# Forecast future GDP
forecast = await mcp.call_tool("forecast_data", {
    "data": gdp_data,
    "time_column": "year",
    "value_column": "gdp",
    "periods_ahead": 5
})

# Compare against benchmarks
comparison = await mcp.call_tool("benchmark_data", {
    "data": city_data,
    "value_column": "gdp_pc",
    "entity_column": "city",
    "benchmarks": {"EU average": 35000}
})
Create a Full Infographic
story = await mcp.call_tool("create_infographic", {
    "data": population_data,
    "title": "Srbija po Popisu 2022",
    "chart_type": "bar",
    "x_column": "district",
    "y_column": "population_2022",
    "extra_big_numbers": [
        {"number": "6.6M", "label": "Ukupno stanovnika", "color": "gold", "trend": "down"},
        {"number": "23%", "label": "Beograd region", "color": "blue", "trend": "up"},
    ],
    "timeline_events": [
        {"year": "2002", "label": "Popis 2002", "dot_class": ""},
        {"year": "2022", "label": "Popis 2022", "dot_class": "gold"},
    ]
})
Available MCP Tools
Data Access
| Tool | Description |
|---|---|
search_datasets |
Search 3,400+ datasets with filters |
get_dataset |
Get complete dataset details |
get_resource_data |
Download and parse resource data |
list_organizations |
Browse data providers |
suggest_datasets |
Autocomplete for search |
Data Transformation
| Tool | Description |
|---|---|
filter_data |
Filter rows by conditions |
group_data |
Group and aggregate |
sort_data |
Sort by column(s) |
select_columns |
Select/rename columns |
data_profile |
Statistical summary of dataset |
Basic Charts
| Tool | Description |
|---|---|
create_visualization |
Line, bar, pie, scatter, histogram, box plot |
create_advanced_visualization |
Heatmap, treemap, gauge, funnel, sparklines, animated |
create_arrow_chart |
Directional arrow chart |
create_dumbbell_chart |
Before/after comparison |
Novel Charts
| Tool | Description |
|---|---|
create_slope_chart |
Ranking changes between two periods |
create_waffle_chart |
Proportional icon grid |
create_population_pyramid |
Age × sex demographic distribution |
create_sankey_diagram |
Budget/energy flow visualization |
create_radar_chart |
Multi-metric spider comparison |
Maps
| Tool | Description |
|---|---|
create_choropleth_map |
Colored district map of Serbia |
create_bubble_map |
Bubble-sized district map |
create_multi_layer_map |
Toggle between indicators |
Analytics & Forecasting
| Tool | Description |
|---|---|
forecast_data |
Linear/exponential projections |
benchmark_data |
Compare against reference values |
compare_cross_dataset |
Cross-dataset correlations |
Storytelling
| Tool | Description |
|---|---|
create_infographic |
Full data story with KPIs, timeline, chart, insights |
create_dashboard |
Multi-panel dashboard layout |
create_scrollytelling |
Scroll-driven interactive story |
Export & Sharing
| Tool | Description |
|---|---|
export_visualization |
Export as HTML, JSON, PNG, or PDF |
generate_embed |
Generate iframe embed code |
enhance_chart_tooltips |
Add rich contextual tooltips |
📚 Documentation
- Quick Start Guide — Get started in 5 minutes
- Usage Examples — 24+ real-world examples and use cases
- API Reference — Complete tool documentation with parameters
- Troubleshooting — Common issues and solutions
- Contributing Guide — Developer contribution guidelines
Development
Setup Development Environment
make install
Generate Showcase Exports
uv run python generate_showcase.py
This creates 12 polished HTML files in exports/ demonstrating all chart types with sample Serbian data.
Running Tests
make test       # Run all tests with coverage
make test-quick # Quick tests (no coverage)
Code Quality Checks
make check      # Run all quality checks (lint, format, type-check, security)
make check-quick # Quick checks (lint + format only)
Project Structure
serbian-data-mcp/
├── exports/                     # Generated HTML visualizations
├── src/serbian_data_mcp/
│   ├── api/                     # API client for data.gov.rs
│   ├── catalog/                 # Dataset catalog and search
│   ├── data/                    # Data parsing and transformation
│   ├── intelligence/            # Query expansion and smart search
│   ├── viz/
│   │   ├── charts.py            # Basic 6 chart types (auto-themed)
│   │   ├── advanced_charts.py   # Heatmap, treemap, gauge, funnel, sparklines
│   │   ├── novel_charts.py      # Slope, waffle, pyramid, sankey, radar
│   │   ├── maps.py              # Choropleth map of 25 Serbian districts
│   │   ├── map_advanced.py      # Bubble map, multi-layer map
│   │   ├── infographics.py      # Full infographic builder
│   │   ├── scrollytelling.py    # Scroll-driven HTML stories
│   │   ├── animations.py        # Animated charts (timeline, bars, comparison)
│   │   ├── themes.py            # Dark/light/infographic themes
│   │   ├── insights.py         # Auto-extracted insights & narratives
│   │   ├── tooltips.py          # Rich hover tooltips
│   │   ├── forecast.py          # Linear/exponential forecasting
│   │   ├── data_tables.py        # Styled data tables
│   │   ├── special_charts.py    # Arrow, dumbbell, lollipop
│   │   ├── exporters.py         # HTML/PNG/JSON/PDF/export
│   │   └── datawrapper_export.py # Datawrapper cloud API
│   ├── config.py                # Configuration management
│   ├── exceptions.py            # Custom exceptions
│   └── tools.py                 # MCP tool definitions (30+ tools)
├── tests/                       # Comprehensive test suite (314 tests)
├── generate_showcase.py         # Generate showcase HTML exports
├── .github/workflows/           # CI/CD configuration
├── pyproject.toml               # Project configuration
└── Makefile                     # Development commands
License
MIT License - see LICENSE file
Установка Serbian Data
У этого сервера нет опубликованного пакета — он собирается из исходников. Открой репозиторий и следуй инструкции в README.
▸ github.com/acailic/serbian-data-mcpFAQ
Serbian Data MCP бесплатный?
Да, Serbian Data MCP бесплатный — установка в пару кликов через Unyly без оплаты.
Нужен ли API-ключ для Serbian Data?
Нет, Serbian Data работает без API-ключей и переменных окружения.
Serbian Data — hosted или self-hosted?
Доступен hosted-вариант: Unyly запускает сервер в облаке, локальная установка не обязательна.
Как установить Serbian Data в Claude Desktop, Claude Code или Cursor?
Открой Serbian Data на unyly.org, выбери вкладку своего клиента (Claude Desktop, Claude Code, Cursor) и нажми Install — конфиг сгенерируется автоматически, без правки JSON.
Похожие MCP
GitHub
PRs, issues, code search, CI status
 автор: GitHub
Filesystem
Secure file operations with configurable access controls.
Memory
Knowledge graph-based persistent memory system.
Template MCP Server
A CLI tool to create a new Model Context Protocol server project with TypeScript support, dual transport options, and an extensible structure
 автор: mcpdotdirect
Compare Serbian Data with
Не уверен что выбрать?
Найди свой стек за 60 секунд
Автор?
Embed-бейдж для README
Похожее
Все в категории development