
Ai Assistant
БесплатноНе проверенMCP-Powered AI Assistant with Pluggable Tools | Python, MCP,FastAPI, LangChain,Ollama, Redis, PostgreSQL, Docker, Prometheus, Grafana Built a single-agent AI as

Описание
MCP-Powered AI Assistant with Pluggable Tools | Python, MCP,FastAPI, LangChain,Ollama, Redis, PostgreSQL, Docker, Prometheus, Grafana Built a single-agent AI assistant that dynamically discovers and invokes tools exposed as MCP servers, enabling plug-and-play capability extension without code changes.
README
Pluggable AI tools via Model Context Protocol
Python >= 3.11 FastAPI Docker License: MIT PRs Welcome
A modular, production-grade AI agent platform with runtime tool discovery, multi-tool orchestration, and full-stack observability. New capabilities can be added by starting a container — no agent restarts, no code changes, no redeployment.
Built on Anthropic's Model Context Protocol (MCP), this project demonstrates a production-grade architecture for pluggable AI tooling: a LangChain ReAct agent discovers MCP-compatible tool servers over the network, builds LangChain-compatible tool bindings on the fly, and orchestrates multi-step tool chains to answer user queries.
100% local. Runs entirely on your machine with Ollama. No API keys, no cloud costs.
Key Features
- Pluggable Tool Architecture — Each tool server is an independent service with its own container. Add, remove, or update tools without touching the agent.
- Dynamic Tool Discovery — The agent auto-detects MCP servers at runtime via SSE. New tools appear within seconds of a server starting.
- Multi-Tool Chains — The ReAct agent autonomously orchestrates multiple tools in sequence to answer complex queries (e.g., search the web, then summarize, then save a note).
- Smart Caching — Redis caches tool results with configurable TTL. Repeated queries skip the tool call entirely.
- Full Observability — Prometheus metrics (8 instruments) with a pre-built Grafana dashboard covering tool latency, success rates, cache hit ratio, and HTTP performance.
- Conversation Memory — Per-session chat history so the agent remembers context across turns.
- PostgreSQL Logging — Every tool invocation and conversation turn is logged with full analytics endpoints.
- One-Command Deploy —
docker compose upbrings up 10 containers, fully wired.
Architecture
🏗️ Architecture
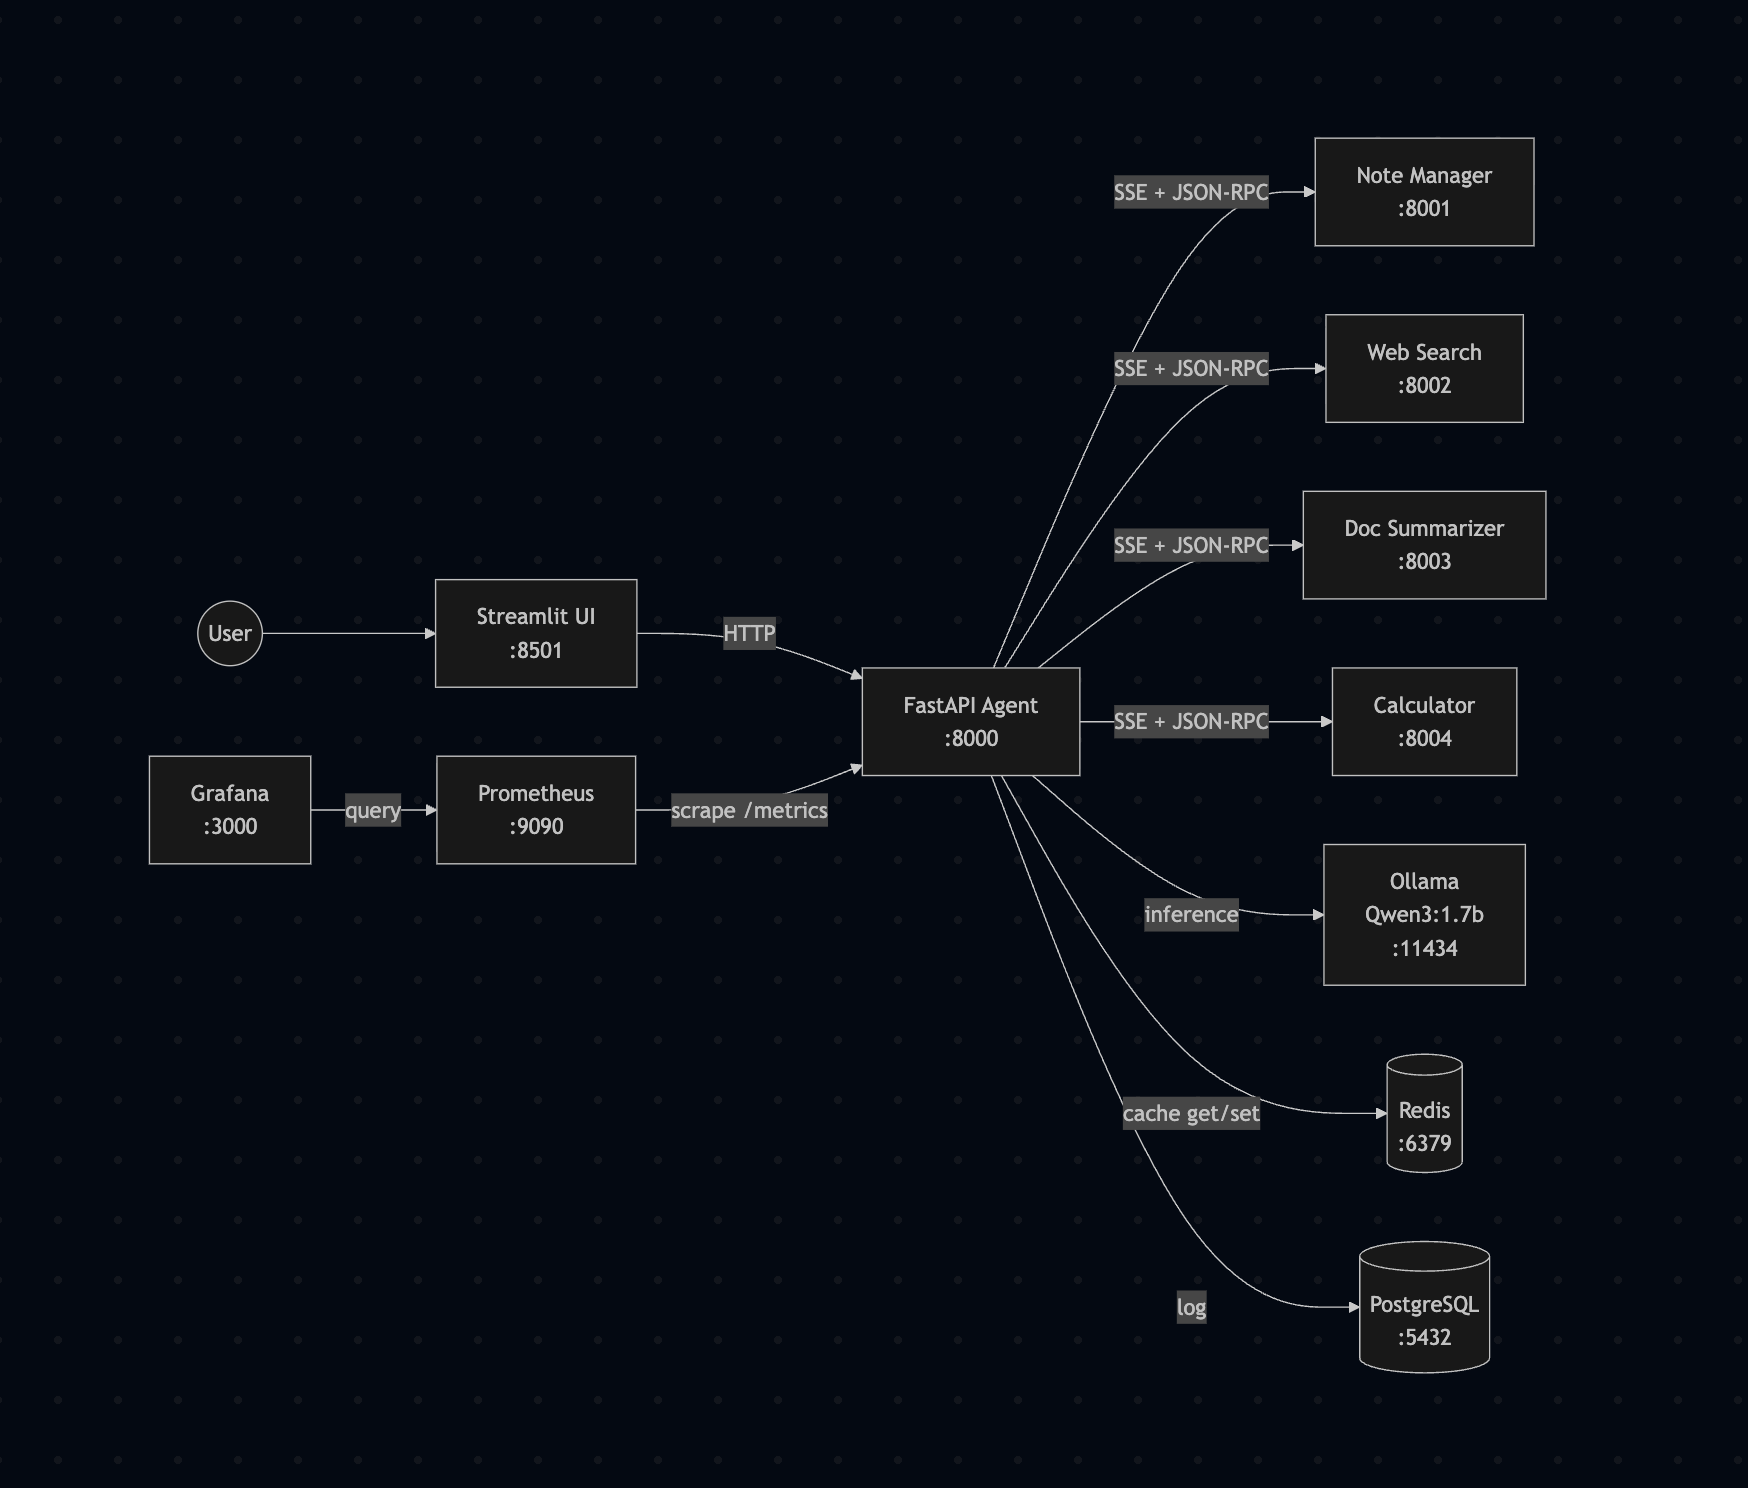
How it works: The agent connects to each MCP server over SSE, calls list_tools() to discover available tools and their JSON schemas, converts those schemas to LangChain-compatible Pydantic models, and binds them as tools for the ReAct agent. When the LLM decides to use a tool, the agent opens an SSE connection to the appropriate server and calls call_tool() with the arguments. Results flow back through the agent to the user.
Tech Stack
| Layer | Technology | Purpose |
|---|---|---|
| LLM | Ollama + Qwen3:1.7b | Local inference, tool calling |
| Agent Framework | LangChain | ReAct agent with tool orchestration |
| API | FastAPI | Async REST API for the agent |
| Tool Protocol | MCP (SSE transport) | Standardized tool discovery and execution |
| UI | Streamlit | Chat interface with analytics dashboard |
| Cache | Redis | Tool result caching with TTL |
| Database | PostgreSQL | Conversation and tool invocation logging |
| Monitoring | Prometheus + Grafana | Metrics collection and visualization |
| Orchestration | Docker Compose | 10-container deployment |
MCP Tool Servers
| Server | Port | Tools | Description |
|---|---|---|---|
| Note Manager | 8001 | save_note, get_notes, search_notes |
Persistent note storage with tag filtering and keyword search |
| Web Search | 8002 | web_search, fetch_url |
DuckDuckGo search and web page content extraction |
| Doc Summarizer | 8003 | summarize_text, extract_key_points |
LLM-powered text summarization and key point extraction |
| Calculator | 8004 | calculate, convert_units |
Safe math evaluation (AST-based) and unit conversion |
Each server also exposes a health_check tool. 13 tools total across 4 servers.
Quick Start
Prerequisites
- Python >= 3.11 (tested with 3.14.2)
- Docker Desktop (4 GB+ RAM allocated)
- Ollama with Qwen3:1.7b pulled
ollama pull qwen3:1.7b
Run
git clone https://github.com/gulabjamun04/mcp-ai-assistant.git
cd mcp-ai-assistant
docker compose up --build -d
Wait ~60 seconds for all services to become healthy, then:
| Service | URL |
|---|---|
| Chat UI | http://localhost:8501 |
| Agent API | http://localhost:8000/docs |
| Grafana | http://localhost:3000 (admin / admin) |
| Prometheus | http://localhost:9090 |
Pull the model into Docker's Ollama
# After containers are up, pull the model into the containerized Ollama
./scripts/pull_model.sh
Dynamic Discovery Demo
See the core value proposition in action — a new tool server is started while the agent is running, and it picks up the new tools automatically:
python scripts/demo.py
Step 1: 10 tools from 3 servers
Step 2: "What is 15% of 250?" → LLM answers alone (no tools)
Step 3: 🚀 Starting calculator container...
Step 4: ✅ 3 new tools discovered → 13 tools from 4 servers
Step 5: Same question → routes to [calculate] tool
Step 6: "Convert 100 km to miles" → [convert_units] tool
Zero code changes. Zero restarts.
API Endpoints
| Method | Endpoint | Description |
|---|---|---|
POST |
/chat |
Send a message, get a response with tool usage info |
GET |
/tools |
List all discovered MCP tools |
POST |
/tools/refresh |
Trigger manual tool re-discovery |
GET |
/health |
Agent and server health status |
GET |
/cache/stats |
Cache hit/miss statistics |
DELETE |
/cache/clear |
Flush cached tool results |
GET |
/analytics/tools |
Tool usage analytics |
GET |
/analytics/sessions |
Session statistics |
GET |
/analytics/recent |
Last 20 tool invocations |
GET |
/metrics |
Prometheus metrics |
Monitoring
The Grafana dashboard (MCP AI Assistant) is auto-provisioned and includes:
| Panel | Metric |
|---|---|
| Total Tool Invocations | mcp_tool_invocations_total |
| Active Sessions | mcp_active_sessions |
| Cache Hit Rate | mcp_cache_operations_total |
| Available Tools | mcp_available_tools |
| Tool Invocations Over Time | rate(mcp_tool_invocations_total[5m]) |
| Average Tool Latency | mcp_tool_duration_seconds |
| Tool Success Rate | Success / total by tool |
| HTTP Request Rate | mcp_http_requests_total |
| Response Time Percentiles | P50 / P95 / P99 |
| Error Rate | 5xx + tool errors |
Access at http://localhost:3000 (admin / admin).
Adding a New Tool Server
The whole point of this architecture is that adding new capabilities is trivial:
1. Create the server — a single Python file using the MCP SDK:
from mcp.server.fastmcp import FastMCP

mcp = FastMCP("my-server", host="0.0.0.0", port=8005)

@mcp.tool()
def my_tool(query: str) -> dict:
    """Tool description for the LLM."""
    return {"result": do_something(query)}

if __name__ == "__main__":
    mcp.run(transport="sse")
2. Create a Dockerfile:
FROM python:3.11-slim
WORKDIR /app
RUN pip install --no-cache-dir mcp
COPY mcp_servers/__init__.py ./mcp_servers/__init__.py
COPY mcp_servers/my_server/ ./mcp_servers/my_server/
EXPOSE 8005
CMD ["python", "-m", "mcp_servers.my_server.server"]
3. Add to docker-compose.yml and agent/config.py.
4. Start it:
docker compose up -d my-server
curl -X POST http://localhost:8000/tools/refresh
5. Done. The agent discovers and uses the new tools immediately.
Project Structure
mcp-ai-assistant/
├── agent/                          # Core AI agent (FastAPI)
│   ├── agent.py                    #   LangChain ReAct agent + session memory
│   ├── cache.py                    #   Redis caching layer
│   ├── config.py                   #   Settings from .env
│   ├── database.py                 #   PostgreSQL logging + analytics
│   ├── main.py                     #   FastAPI app + endpoints
│   ├── mcp_client.py               #   MCP tool registry + discovery
│   └── metrics.py                  #   Prometheus instrumentation
│
├── mcp_servers/                    # MCP tool servers (one per subdirectory)
│   ├── note_manager/               #   Note storage (port 8001)
│   ├── web_search/                 #   Web search + fetch (port 8002)
│   ├── doc_summarizer/             #   Text summarization (port 8003)
│   └── calculator/                 #   Math + unit conversion (port 8004)
│
├── ui/                             # Streamlit chat interface
│   ├── app.py                      #   Entry point
│   ├── api.py                      #   Backend API client
│   └── components/                 #   Chat, sidebar, analytics pages
│
├── monitoring/                     # Observability
│   ├── prometheus/prometheus.yml   #   Scrape config
│   └── grafana/                    #   Dashboard + provisioning
│
├── docker/                         # Docker build files
│   ├── Dockerfile.agent
│   └── init.sql                    #   PostgreSQL schema
│
├── scripts/
│   ├── demo.py                     #   Dynamic discovery demo
│   ├── test_docker.py              #   Docker integration tests
│   ├── pull_model.sh               #   Pull Ollama model into container
│   └── run_local.py                #   Local development launcher
│
├── tests/                          # 161 unit tests
│   ├── test_note_manager.py
│   ├── test_web_search.py
│   ├── test_doc_summarizer.py
│   ├── test_calculator.py
│   ├── test_cache.py
│   └── test_database.py
│
├── docker-compose.yml              # 10-service orchestration
├── requirements.txt
└── .env                            # Environment configuration
Testing
# Run all 161 tests
python -m pytest tests/ -v

# Run a specific server's tests
python -m pytest tests/test_calculator.py -v

# Run Docker integration tests (requires docker compose up)
python scripts/test_docker.py
Key Features
Runtime Tool Discovery — Agent auto-registers MCP servers via SSE and binds JSON-schema-defined tools dynamically.
Zero-Downtime Extensibility — New tool containers are detected and usable within seconds, no agent restart required.
Multi-Step Tool Orchestration — ReAct agent sequences up to 3+ tools per query (e.g., search → summarize → persist).
Distributed Architecture — 4 isolated MCP servers exposing 13 tools across 10 Docker containers.
Production Observability — Prometheus metrics (8 instruments) with Grafana dashboards covering latency (P50/P95/P99), tool success rate, cache metrics, and HTTP throughput.
Cache Optimization Layer — Redis TTL-based caching reduces redundant LLM and tool execution.
Structured Logging & Analytics — PostgreSQL-backed invocation logging with analytics endpoints.
Screenshots
Chat Interface
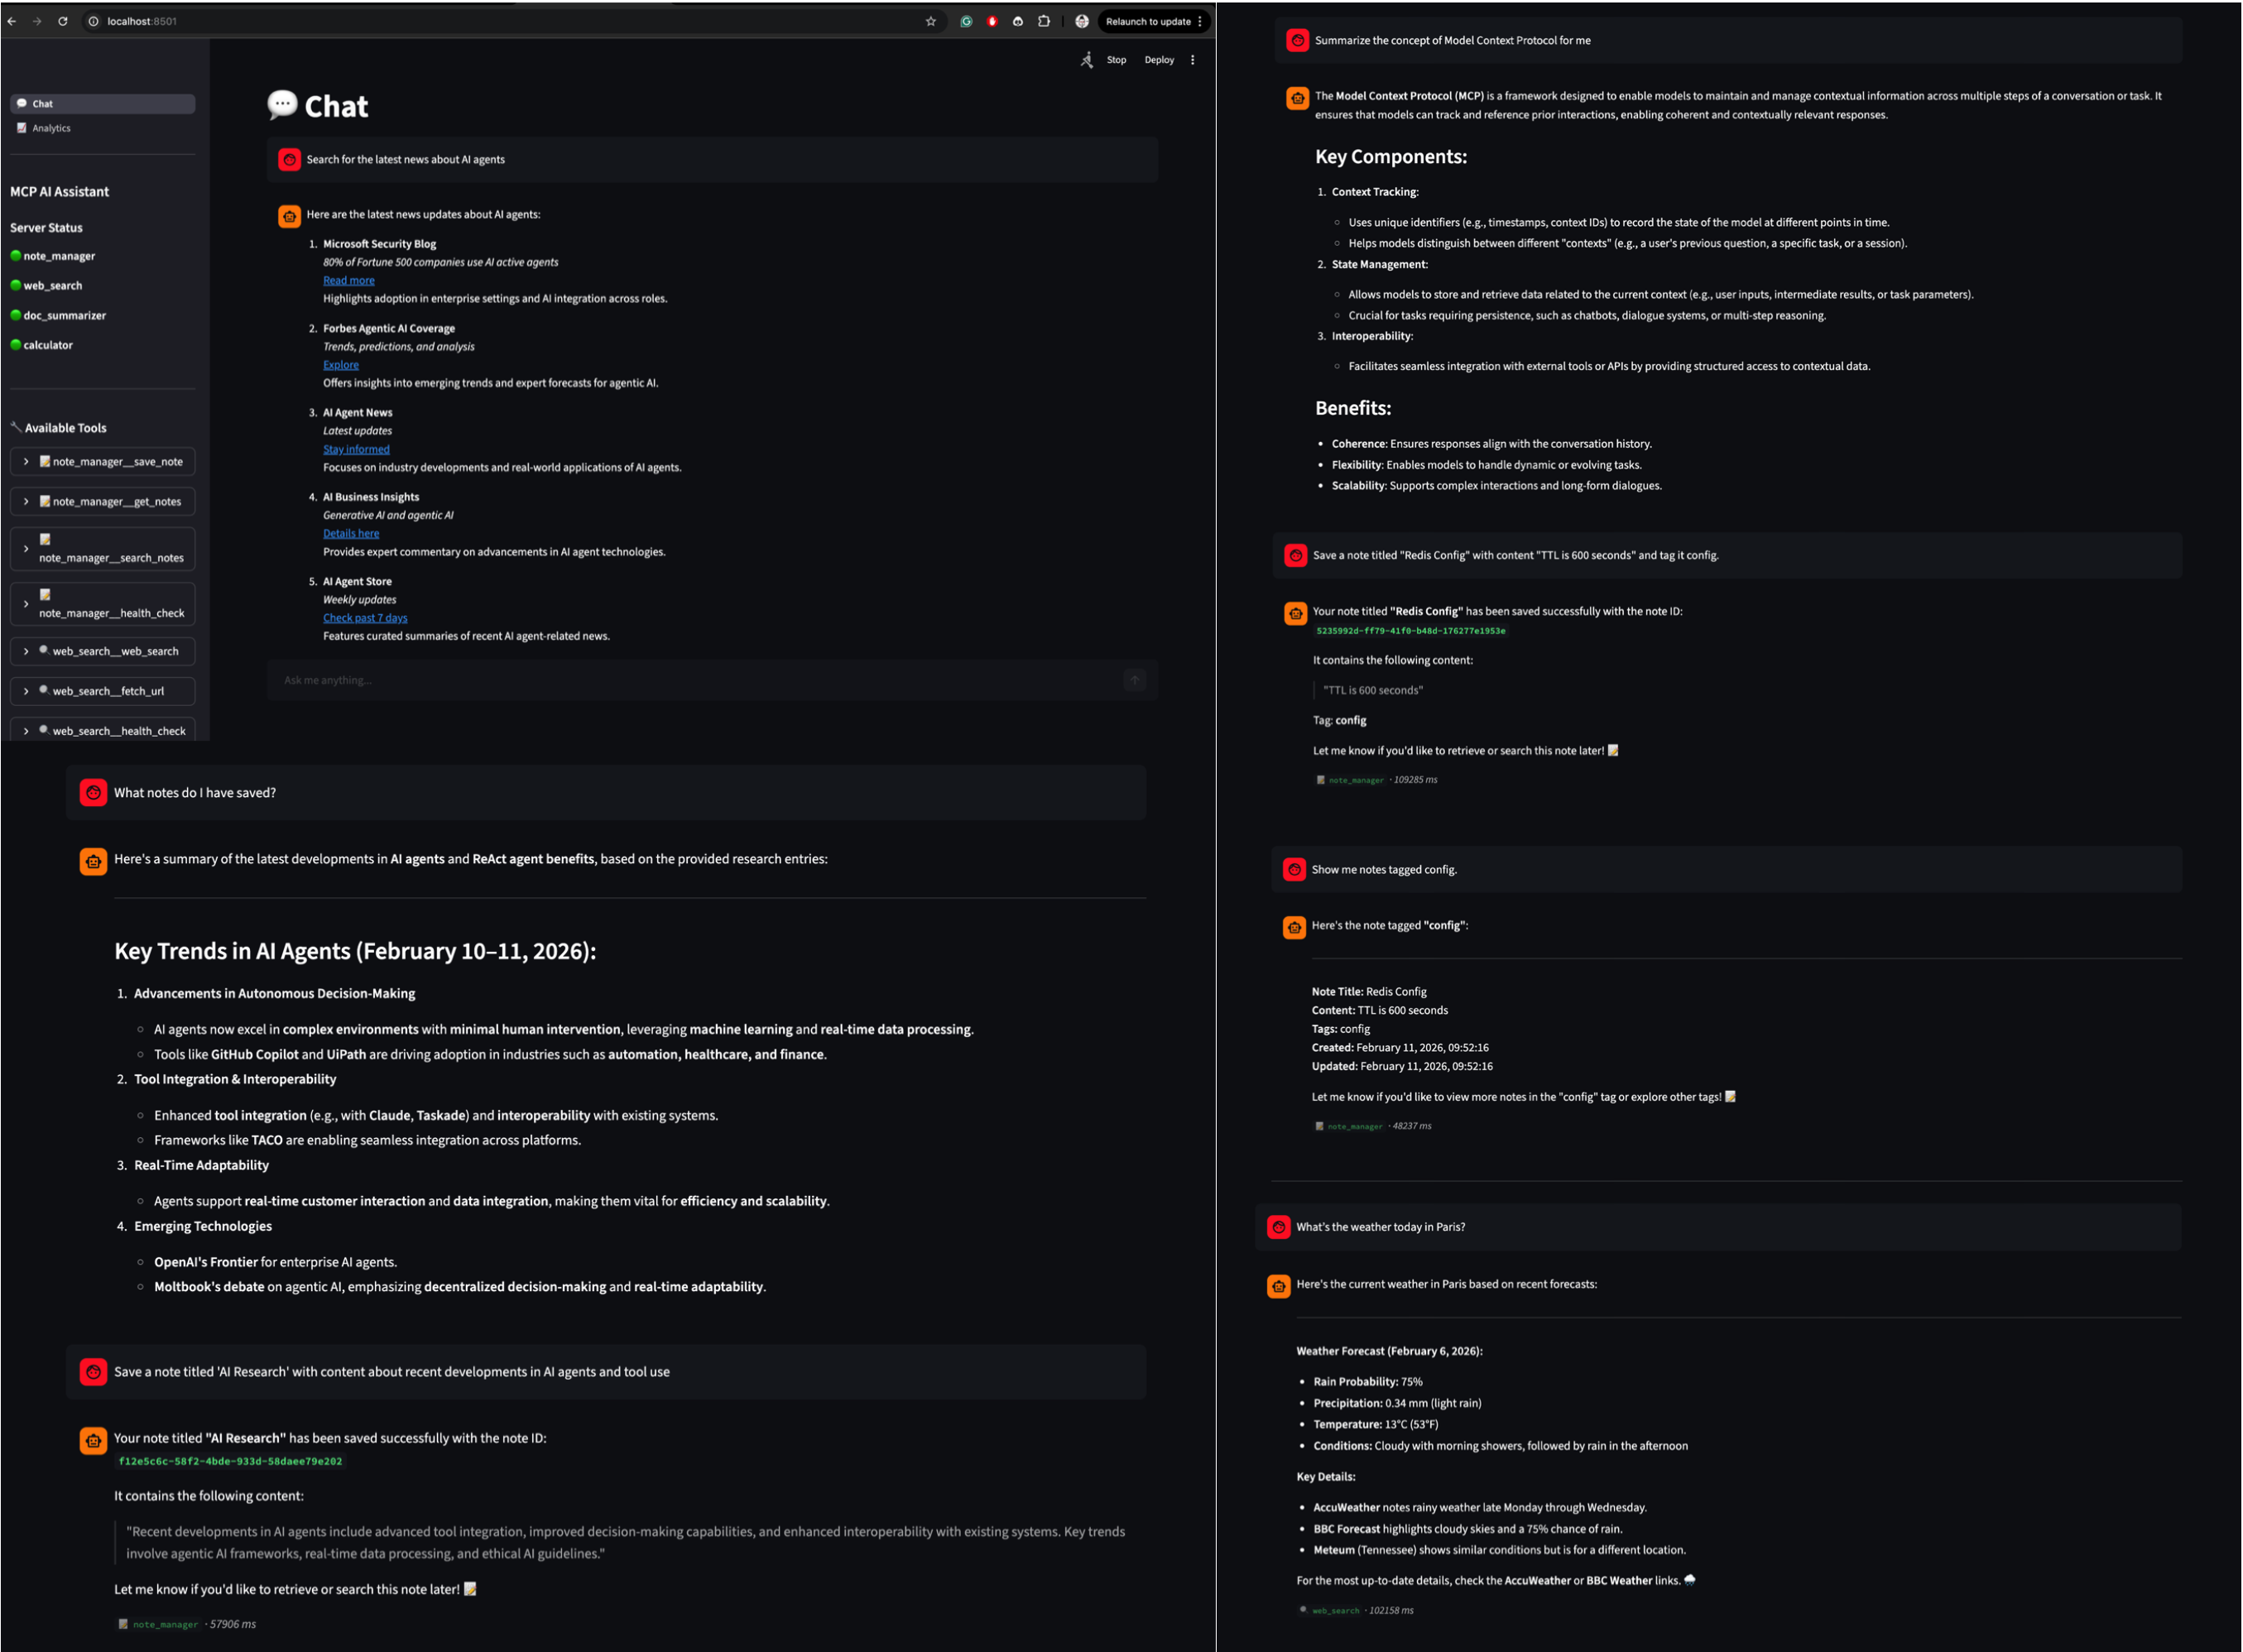
Multi-tool conversations with the ReAct agent — search the web, save notes, summarize documents, and calculate values, all in one session.
Analytics Dashboard
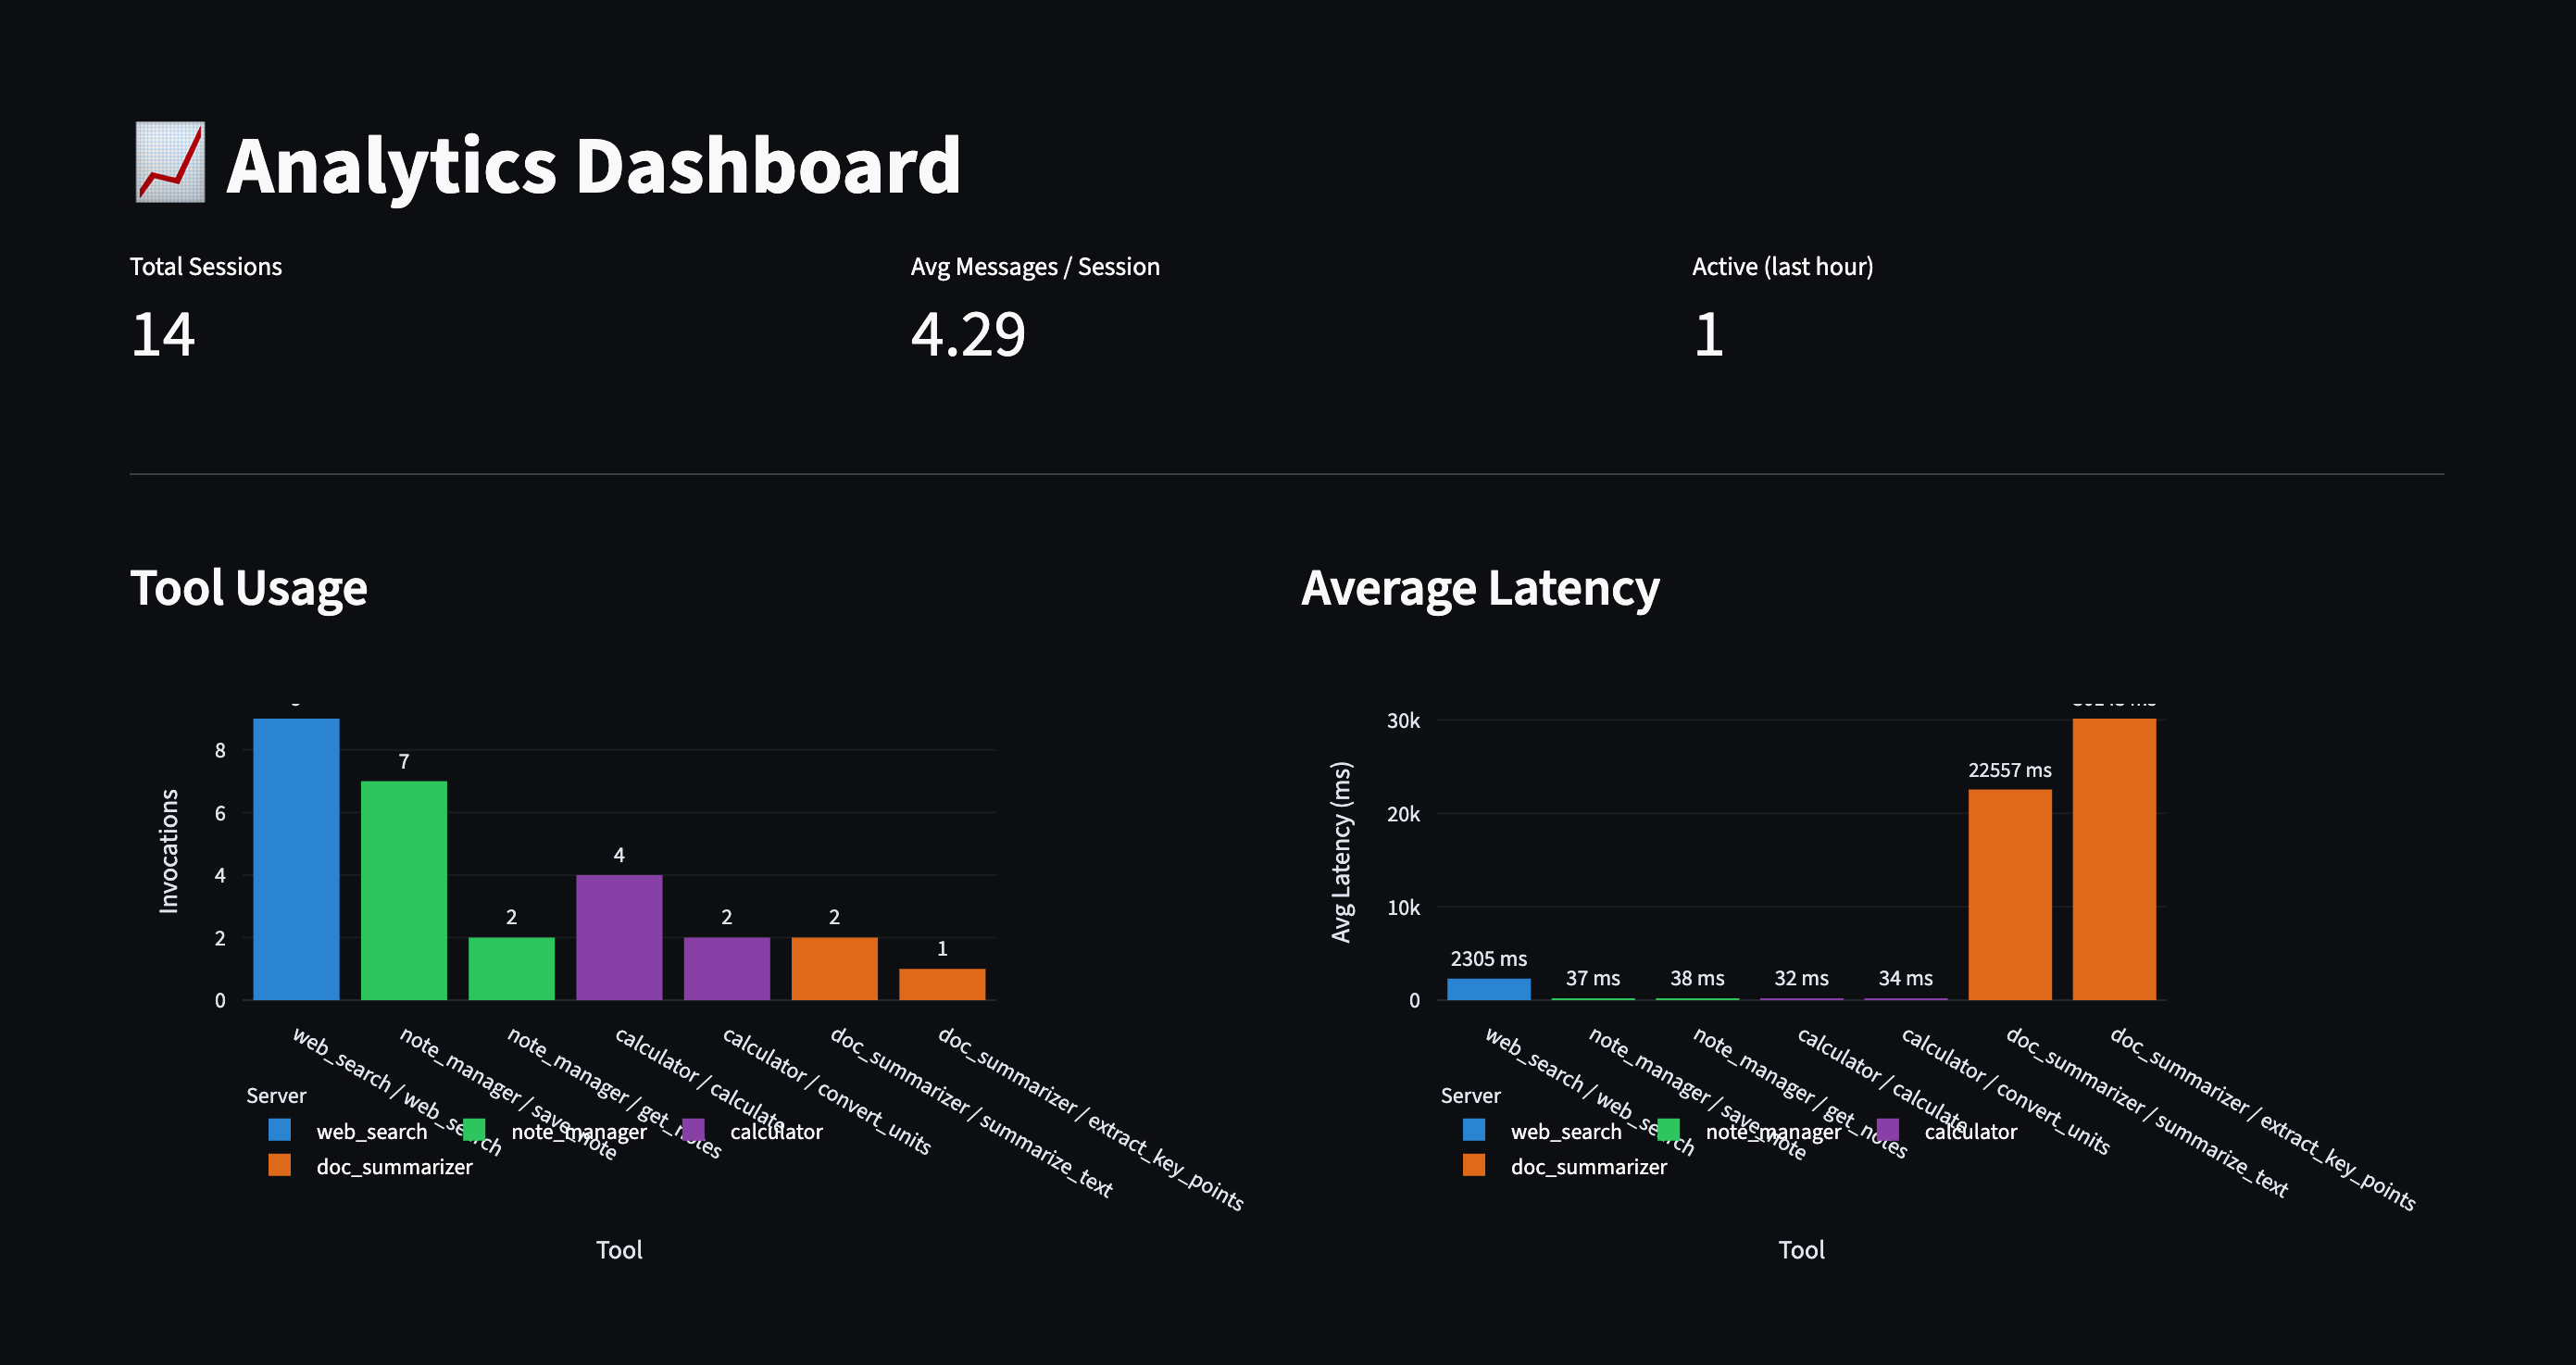
Session metrics, tool usage breakdown, and recent activity — all powered by PostgreSQL logging.
Grafana Monitoring
Real-time observability: tool latency, cache hit rates, HTTP performance, and active sessions.
Monitoring & Observability
The auto-provisioned MCP AI Assistant Grafana dashboard includes:
Total Tool Invocations
Active Sessions
Cache Hit Ratio
Available Tool Count
Tool Success Rate (per tool)
Average Tool Latency
Invocation Rate
HTTP Request Rate
Response Time Percentiles (P50 / P95 / P99)
Error Rate
All metrics are exposed via /metrics and scraped by Prometheus.
Dynamic Tool Discovery
A new MCP server starts and the agent picks up its tools automatically — zero restarts, zero code changes.
▶ Watch Dynamic Discovery Demo
Contributing
Contributions are welcome. To add a feature:
- Fork the repository
- Create a feature branch (
git checkout -b feature/my-feature) - Write tests for your changes
- Ensure all tests pass (
python -m pytest tests/ -v) - Open a pull request
License
This project is licensed under the MIT License. See LICENSE for details.
Author
Shivesh Dave
Установка Ai Assistant
У этого сервера нет опубликованного пакета — он собирается из исходников. Открой репозиторий и следуй инструкции в README.
▸ github.com/gulabjamun04/mcp-ai-assistantFAQ
Ai Assistant MCP бесплатный?
Да, Ai Assistant MCP бесплатный — установка в пару кликов через Unyly без оплаты.
Нужен ли API-ключ для Ai Assistant?
Нет, Ai Assistant работает без API-ключей и переменных окружения.
Ai Assistant — hosted или self-hosted?
Self-hosted: сервер запускается локально на твоей машине командой из раздела установки.
Как установить Ai Assistant в Claude Desktop, Claude Code или Cursor?
Открой Ai Assistant на unyly.org, выбери вкладку своего клиента (Claude Desktop, Claude Code, Cursor) и нажми Install — конфиг сгенерируется автоматически, без правки JSON.
Похожие MCP
wenb1n-dev/SmartDB_MCP
A universal database MCP server supporting simultaneous connections to multiple databases. It provides tools for database operations, health analysis, SQL optim
 автор: wenb1n-dev
Postgres Server
This server enables interaction with PostgreSQL databases through the Model Context Protocol, optimized for the AWS Bedrock AgentCore Runtime. It provides tools
 автор: madhurprash
Postgres
Query your database in natural language
 автор: Anthropic
PostgreSQL
Read-only database access with schema inspection.
автор: modelcontextprotocolCompare Ai Assistant with
Не уверен что выбрать?
Найди свой стек за 60 секунд
Автор?
Embed-бейдж для README
Похожее
Все в категории data