
air-Q Cloud
БесплатноНе проверенMCP server for air-Q Cloud API — access air quality data from anywhere

Описание
MCP server for air-Q Cloud API — access air quality data from anywhere
README

MCP server for the air-Q Cloud API — access air quality data from anywhere.
Unlike mcp-airq (which communicates directly with devices on the local network), this server uses the air-Q Cloud REST API to retrieve sensor data remotely.
The same mcp-airq-cloud executable also works as a direct CLI when you pass a
tool name as a subcommand.
Tools
| Tool | Description |
|---|---|
list_devices |
List configured air-Q Cloud devices |
get_air_quality |
Get latest sensor readings (supports device/location/group selection) |
get_air_quality_history |
Get historical data within a time range as column-oriented JSON |
plot_air_quality_history |
Render one historical chart per sensor across all matching devices |
export_air_quality_history |
Export one historical sensor as one csv or xlsx across matching devices |
All tools are read-only — the Cloud API does not support device configuration or control.
Installation
pip install mcp-airq-cloud
Or install from source:
git clone https://github.com/CorantGmbH/mcp-airq-cloud.git
cd mcp-airq-cloud
uv sync --frozen --extra dev
CLI Usage
Use the same command directly from the shell:
mcp-airq-cloud list-devices
mcp-airq-cloud get-air-quality --device "Living Room"
mcp-airq-cloud get-air-quality-history --device "Living Room" --last-hours 24 --sensors co2 pm2_5
mcp-airq-cloud plot-air-quality-history --sensor co2 --output-format png --output co2.png
mcp-airq-cloud export-air-quality-history --sensor co2 --output-format xlsx --output co2.xlsx
For historical plots and exports:
- omit
device,location, andgroupto combine all configured devices into one artifact - use
locationorgroupto combine only the matching devices plot_air_quality_historyreturns one file per requested sensor, with one series per matching deviceexport_air_quality_historyreturns one CSV/XLSX file per request, with rows for all matching devices
The CLI subcommands mirror the MCP tool names. Both styles work:
mcp-airq-cloud list-devices
mcp-airq-cloud list_devices
To force MCP server mode from an interactive terminal, run:
mcp-airq-cloud serve
The CLI is pipe-friendly: successful command output goes to stdout, while
tool errors go to stderr with exit code 1. Plot commands can also stream
directly to stdout.
mcp-airq-cloud get-air-quality --device "Living Room" | jq '.co2'
mcp-airq-cloud get-air-quality-history --device "Living Room" --compact-json | jq '.columns.co2'
mcp-airq-cloud get-air-quality-history --device "Living Room" --yaml | yq '.columns.co2'
mcp-airq-cloud plot-air-quality-history --sensor co2 --device "Living Room" --output - > co2.png
mcp-airq-cloud export-air-quality-history --sensor co2 --device "Living Room" --output - > co2.xlsx
Historical Data
Three tools provide access to historical sensor data via the air-Q Cloud API:
Plotting charts
plot_air_quality_history renders a chart for one sensor. When multiple devices
match, each device becomes a separate series in the same chart.
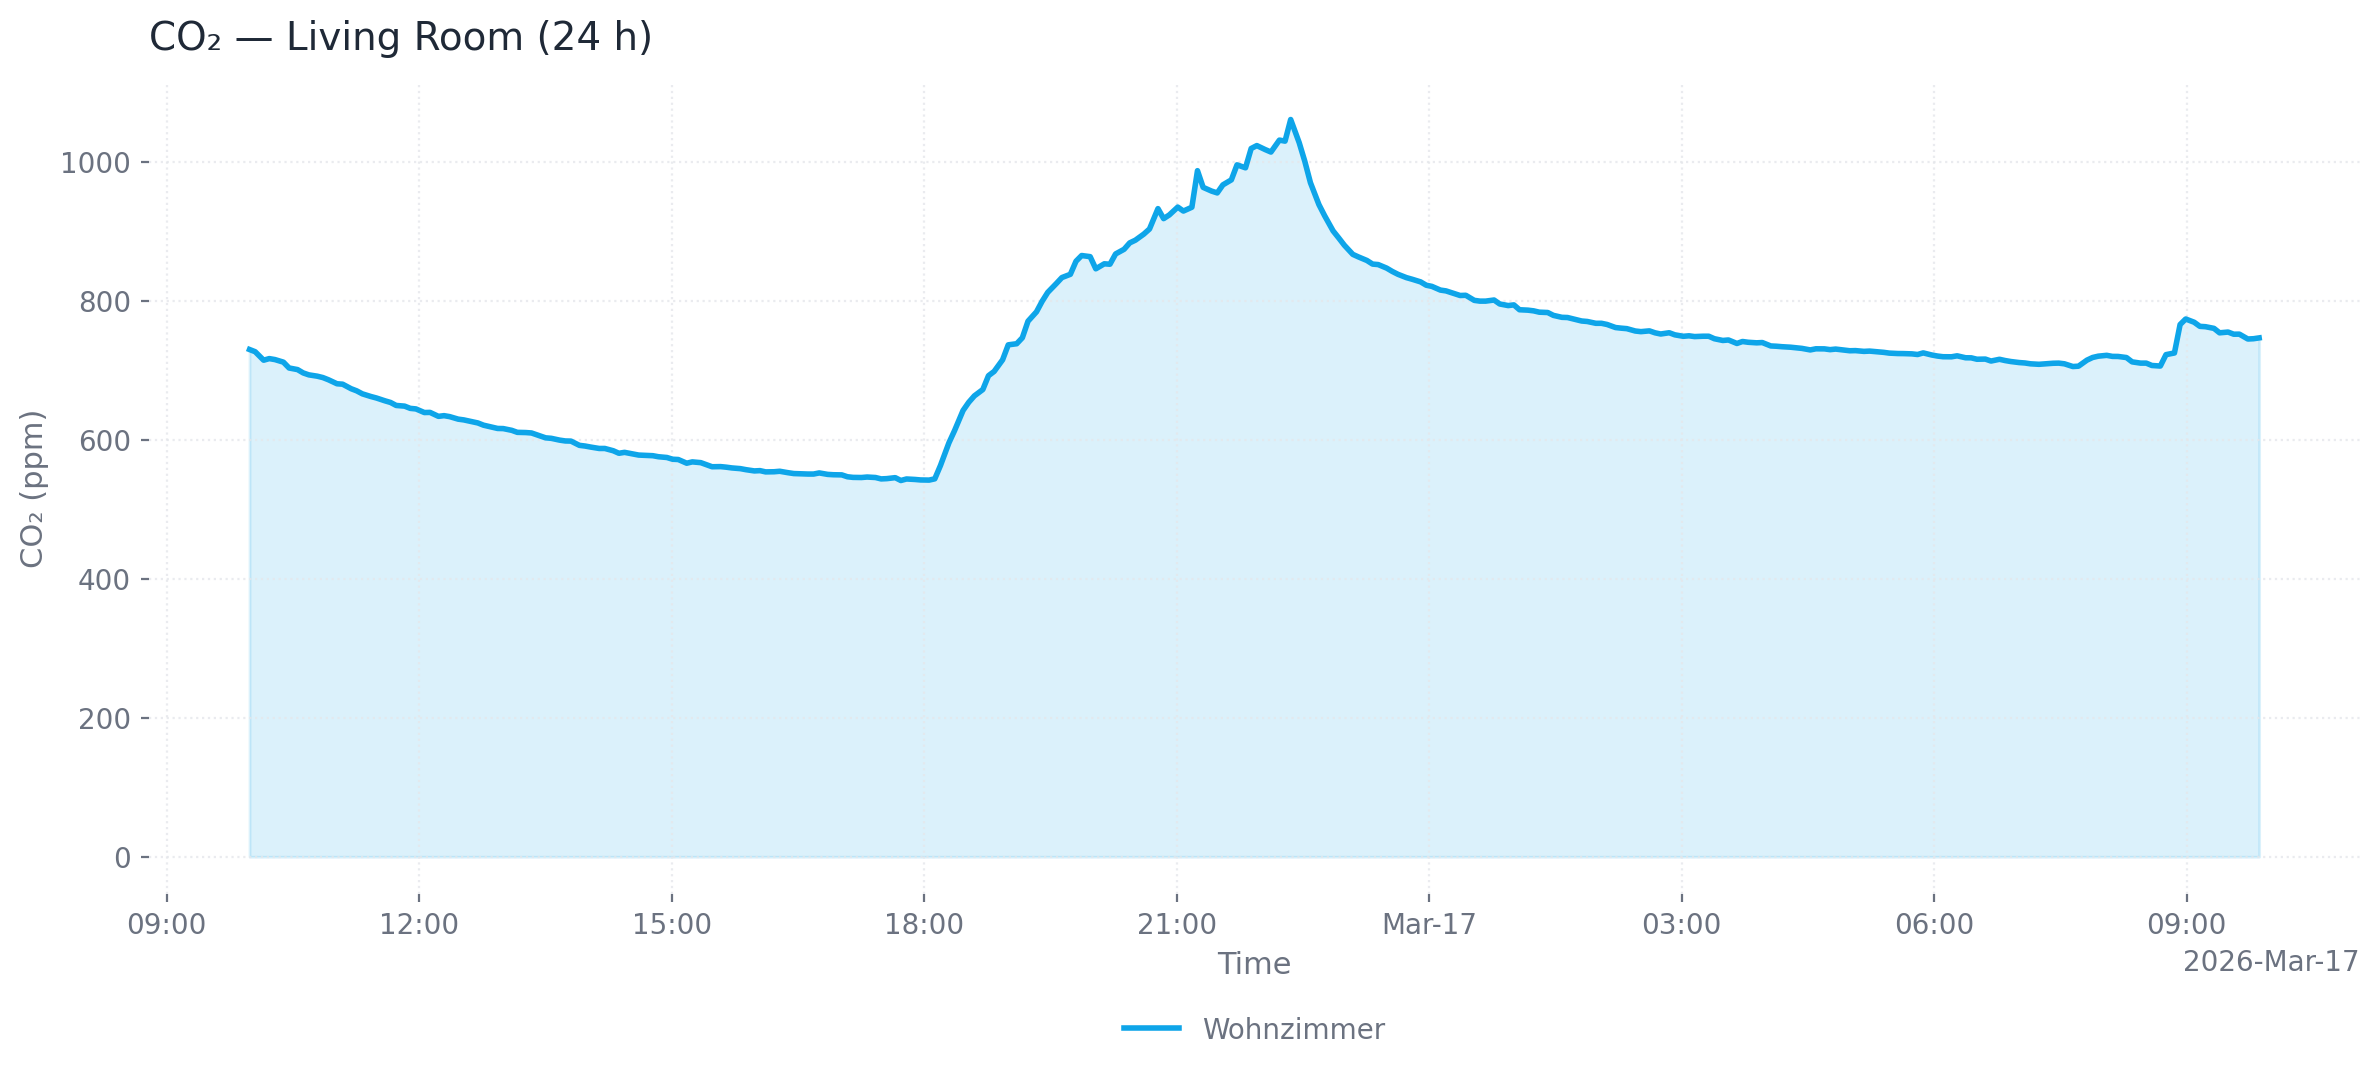
Single device (24 h, area chart, PNG)
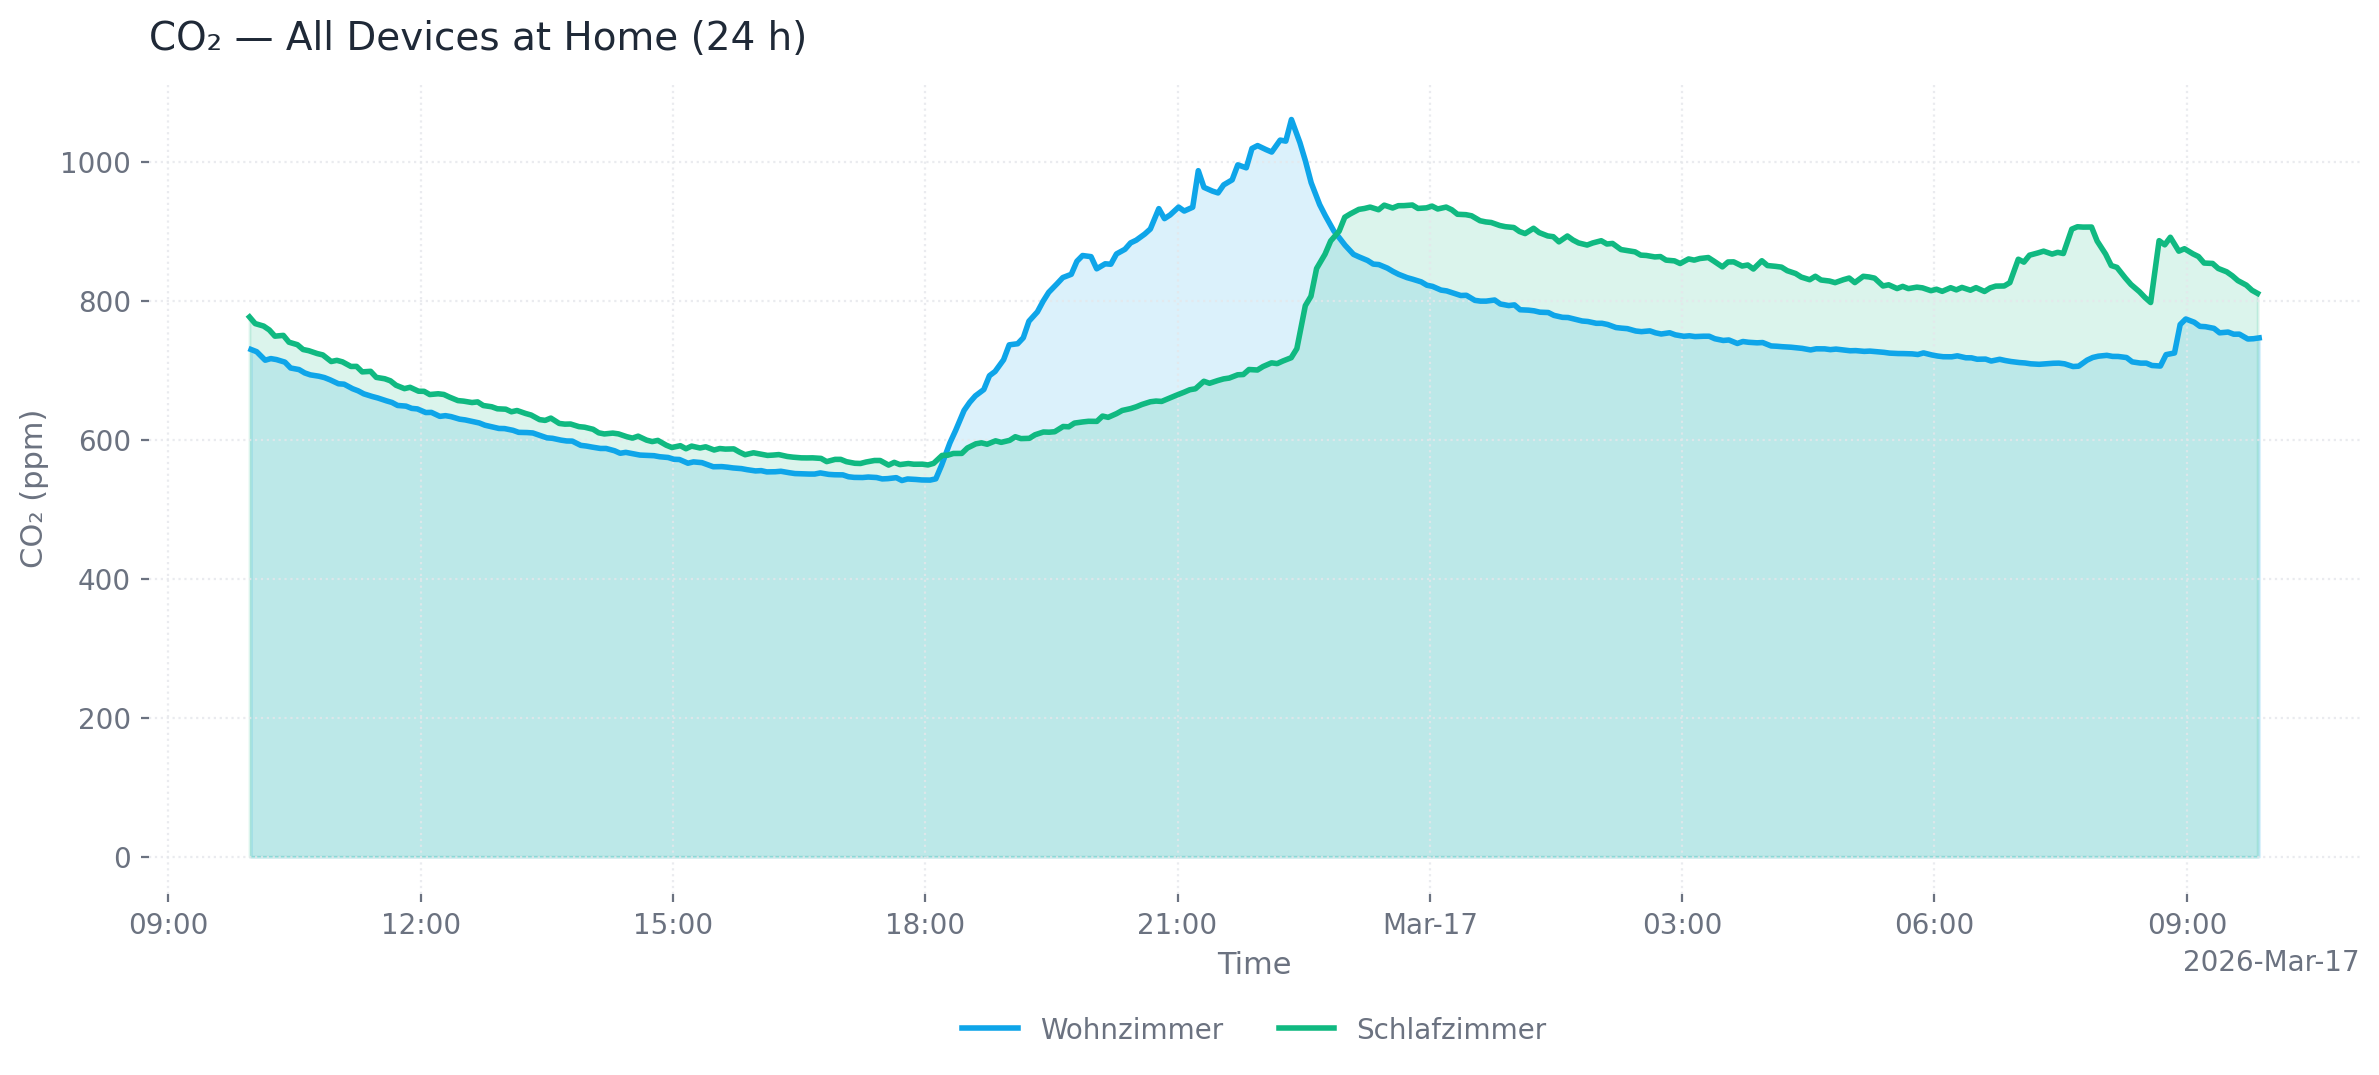
Multiple devices at one location (24 h, area chart, PNG)
# Single device, last 24 hours (default), PNG output (default)
mcp-airq-cloud plot-air-quality-history --sensor co2 --device "Living Room"

# All devices at a location, custom time range, SVG output
mcp-airq-cloud plot-air-quality-history --sensor co2 --location "Living Room" \
  --from-datetime "2026-03-16T00:00:00" --to-datetime "2026-03-17T00:00:00" \
  --output-format svg --output co2.svg

# All configured devices, dark mode, line chart
mcp-airq-cloud plot-air-quality-history --sensor co2 --dark --chart-type line

# Save to file
mcp-airq-cloud plot-air-quality-history --sensor co2 --output co2_chart.png
Output formats: png (default), webp, svg, html (interactive Plotly chart with hover tooltips and zoom)
Customization: --title, --x-axis-title, --y-axis-title, --chart-type (line/area), --dark, --timezone-name
Exporting data
export_air_quality_history produces one CSV or Excel file containing all matching devices.
# CSV export (default)
mcp-airq-cloud export-air-quality-history --sensor co2 --device "Living Room" --last-hours 48

# Excel export for all devices at a location
mcp-airq-cloud export-air-quality-history --sensor co2 --location "Home" \
  --output-format xlsx --output co2.xlsx
Common parameters
| Parameter | Default | Description |
|---|---|---|
--last-hours |
1 (history) / 24 (plot) | Hours of data to retrieve |
--from-datetime / --to-datetime |
— | ISO 8601 time range (overrides --last-hours) |
--max-points |
300 | Downsample to at most N evenly spaced points |
--timezone-name |
UTC | IANA timezone for timestamps (e.g. Europe/Berlin) |
Configuration
You need a Cloud API key and the 32-character device ID for each device. Both can be obtained at my.air-q.com.
Option 1: Environment variable (inline JSON)
export AIRQ_CLOUD_DEVICES='[{"id": "de45d2ed777780c96c0deae7a220b745", "api_key": "your-api-key", "name": "Living Room"}]'
Option 2: Default config file (recommended)
Place a JSON file at ~/.config/airq-cloud-devices.json — no environment variable needed:
[
  {"id": "de45d2ed777780c96c0deae7a220b745", "api_key": "your-api-key", "name": "Living Room"}
]
Option 3: Custom config file path
export AIRQ_CLOUD_CONFIG_FILE=/path/to/devices.json
Option 4: Global API key
If all devices share the same API key, set it once:
export AIRQ_CLOUD_API_KEY="your-api-key"
export AIRQ_CLOUD_DEVICES='[{"id": "de45d2ed777780c96c0deae7a220b745", "name": "Living Room"}]'
Device config fields
| Field | Required | Description |
|---|---|---|
id |
yes | 32-character cloud device ID |
api_key |
no | Per-device API key (falls back to AIRQ_CLOUD_API_KEY) |
name |
no | Friendly name (defaults to first 8 chars of ID) |
location |
no | Location for grouping (e.g. "Wohnzimmer") |
group |
no | Group for grouping (e.g. "zu Hause") |
Usage with Claude Desktop
Add to claude_desktop_config.json:
{
  "mcpServers": {
    "air-Q Cloud": {
      "command": "mcp-airq-cloud",
      "env": {
        "AIRQ_CLOUD_DEVICES": "[{\"id\": \"<device-id>\", \"api_key\": \"<key>\", \"name\": \"Living Room\"}]"
      }
    }
  }
}
Usage with Claude Code
claude mcp add air-Q-Cloud mcp-airq-cloud \
  -e AIRQ_CLOUD_DEVICES='[{"id":"<ID>","api_key":"<KEY>","name":"<Name>"}]'
Development
uv sync --frozen --extra dev
uv run pre-commit install
uv run pytest
The repository uses a project-local .venv plus uv.lock for reproducible
tooling. Run developer commands through uv run, for example:
uv run ruff check .
uv run ruff format --check .
uv run pyright
uv run pre-commit run --all-files
License
Apache 2.0 — see LICENSE.
Установить air-Q Cloud в Claude Desktop, Claude Code, Cursor
unyly install air-q-cloudСтавит в Claude Desktop, Claude Code, Cursor и VS Code — сам разбирается с npx, uvx и сборкой из исходников.
Впервые? Поставь CLI: curl -fsSL https://unyly.org/install | sh
Или настроить вручную
Выполни в терминале:
claude mcp add air-q-cloud -- uvx mcp-airq-cloudFAQ
air-Q Cloud MCP бесплатный?
Да, air-Q Cloud MCP бесплатный — установка в пару кликов через Unyly без оплаты.
Нужен ли API-ключ для air-Q Cloud?
Нет, air-Q Cloud работает без API-ключей и переменных окружения.
air-Q Cloud — hosted или self-hosted?
Self-hosted: сервер запускается локально на твоей машине командой из раздела установки.
Как установить air-Q Cloud в Claude Desktop, Claude Code или Cursor?
Открой air-Q Cloud на unyly.org, выбери вкладку своего клиента (Claude Desktop, Claude Code, Cursor) и нажми Install — конфиг сгенерируется автоматически, без правки JSON.
Похожие MCP
GitHub
PRs, issues, code search, CI status
 автор: GitHub
Filesystem
Secure file operations with configurable access controls.
Memory
Knowledge graph-based persistent memory system.
Template MCP Server
A CLI tool to create a new Model Context Protocol server project with TypeScript support, dual transport options, and an extensible structure
 автор: mcpdotdirect
Compare air-Q Cloud with
Не уверен что выбрать?
Найди свой стек за 60 секунд
Автор?
Embed-бейдж для README
Похожее
Все в категории development