
Bar Observatory
БесплатноНе проверенDeterministic, local-only audit reports for Claude Code AI agent sessions. Rust + SQLite. Zero network calls. MCP server for agents.

Описание
Deterministic, local-only audit reports for Claude Code AI agent sessions. Rust + SQLite. Zero network calls. MCP server for agents.
README
crates.io License: MIT Rust Primary path — zero egress MCP server
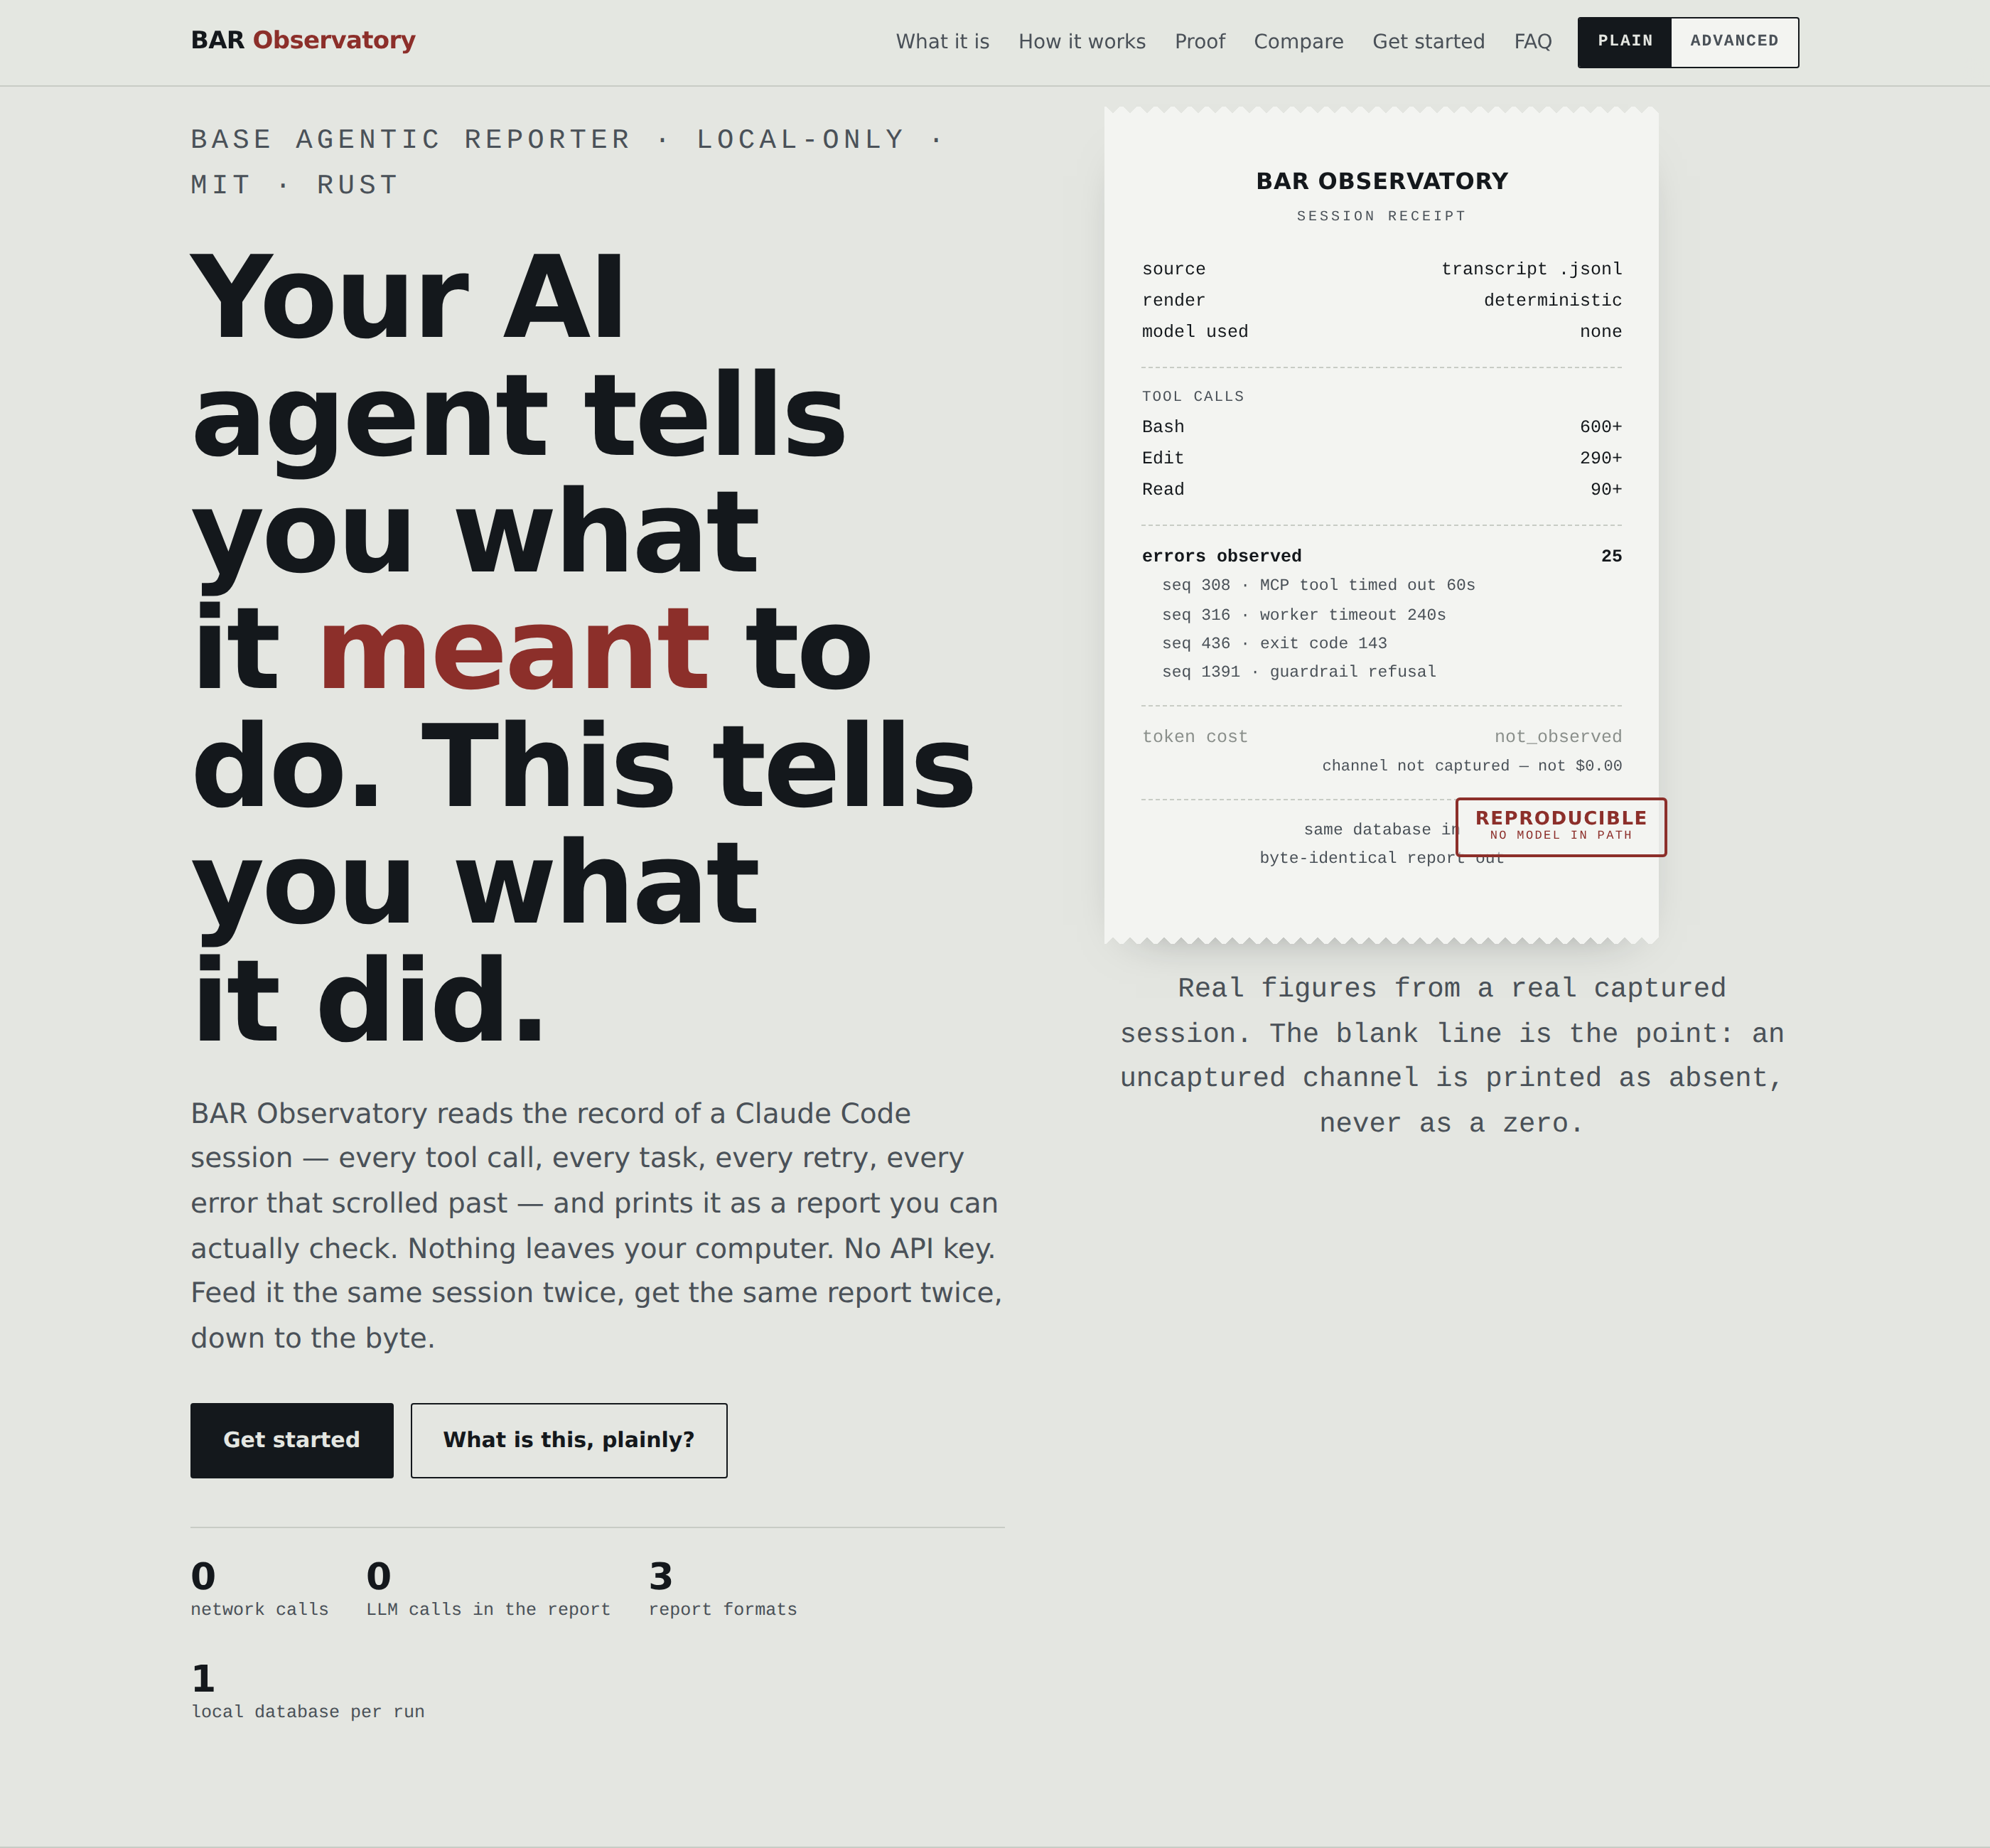
BAR Observatory (Base Agentic Reporter) is a free, open-source, local-only flight recorder and
audit tool for Claude Code sessions. It reads what your AI coding agent actually did — every
tool call, task, sub-agent dispatch, rework loop, and error — stores it in a local SQLite
database, and renders a deterministic report in JSON, HTML, and Markdown. Same database in,
byte-identical report out, every time. No LLM in the render path. No network calls. No API key.
No account. (The optional bar interpret command is the one exception — it uses your own
Claude Code session to write a plain-English summary. The deterministic report never depends on
it and never calls a model itself.)
Don't ask the agent what happened. Check the record.
TL;DR — If you've ever finished a long Claude Code session and thought "what did it actually do in there, and can I prove it?", run one command against the transcript you already have on disk and get a report you can attach to a PR, hand to a reviewer, keep as part of your own review process, or let another AI agent query directly. You do not need to clone or build this repository to do any of that — see Zero-SDK, zero-clone below.
New to command lines? This page covers everything in depth, including some technical detail meant for engineers evaluating the tool. If you'd rather follow a slower, plain-language, click-along guide with no assumed background — including how to open a terminal in the first place — start with the plain-language guide instead, then come back here any time.
Jump to: Zero-SDK, zero-clone · Quickstart · How it works · What's in a report · Comparison · Use cases · For AI agents · FAQ · Limits · Recommended reading · About the author · Acknowledgements
What problem does BAR Observatory solve?
An agentic coding session is a black box that scrolls past. A single Claude Code run can fire hundreds of tool calls, spawn sub-agents that work invisibly, retry the same file four times, hit a timeout partway through, and still end with a confident summary of what it accomplished. The transcript holds the truth, but nobody reads a multi-thousand-turn log file by hand.
Three things break as a result:
- You can't verify the agent's own summary. The agent tells you what it intended. The transcript records what it did. Those are different documents.
- Failures get swallowed. Errors three sub-agents deep scroll past and are gone by the time they matter.
- There's no artifact. Nothing to attach to a PR, hand to a reviewer, show an auditor, or compare against last week's run.
BAR Observatory turns the session record into a receipt: a stable, reproducible document
where every claim resolves to a real, recorded fact — and where anything it couldn't observe is
labeled not_observed rather than quietly reported as zero.
Zero-SDK, zero-clone
Two separate claims worth stating plainly, because one explains most of what follows:
- Zero-SDK. Nothing to
import, no decorator, no line added to your project's own source. BAR Observatory watches the Claude Code session, not your codebase — your repository is untouched, and stays untouched if you uninstall. - Zero-clone. You do not need to clone or build this repository either.
cargo install bar-observatoryor the Claude Code plugin gets you the whole tool; this repo is the front door, documentation, and plugin assets, not something you check out to run BAR Observatory.
Put together, this is also why the primary path works retroactively, why there's no server to run, and why the network-calls badge above reads zero: there's no SDK boundary to cross and no build step in the way, so there's nothing to bootstrap before pointing BAR at a transcript you already have.
Quickstart: your first report in about 60 seconds
The front door is the Claude Code plugin — type these three lines inside your session:
/plugin marketplace add bar181/bar-observatory
/plugin install bar-observatory@bar-observatory
/bar-init
That wires all 21 lifecycle hooks and the read-only MCP server for you — no hand-editing hook
settings, no manual claude mcp add — and adds five slash commands so setup and reporting happen
inside your session instead of a terminal round-trip:
| Command | What it does |
|---|---|
/bar-init |
Start here. Set up .bar/ for this project (idempotent, safe to re-run) |
/bar-report |
Generate the deterministic report (JSON + HTML + MD) |
/bar-interpret |
Generate the optional interpreted self-improvement report (engineering or executive) |
/bar-doctor |
Live health check — is the recorder actually working? |
/bar-query |
Direct read-only DB access — tools, timeline, errors, or raw SQL |
The plugin needs the binaries on PATH (one line, once — no Rust yet? curl https://sh.rustup.rs -sSf | sh gets you cargo in about a minute):
cargo install bar-hook bar-mcp bar-observatory
Disclosed gap, not an oversight: the plugin currently resolves
bar-hook/bar-mcpviaPATHrather than shipping a bundled per-platform binary, because no release pipeline assembles them into the plugin zip yet. Hook commands Claude Code can't resolve fail harmlessly and never block a session — so plugin-before-binaries or binaries-before-plugin are both safe.
No GitHub access, or trying this from a local clone before you rely on the public repo?
/plugin marketplace addaccepts a local folder path just as well as a GitHub reference —/plugin marketplace add /path/to/bar-observatoryworks identically, with no network call at all. The second and third lines (/plugin install …,/bar-init) are unchanged either way.
You do not need a live capture running first. The primary capture path parses a transcript
Claude Code already wrote to disk, so your very first report can be of a session you ran last
month — just run /bar-report once the binaries are on PATH.
Advanced: the CLI directly, no plugin
For scripting, CI, or if you'd rather not install a plugin at all — the same five steps by hand:
# 1. Install the CLI
cargo install bar-observatory

# 2. Set up this project (safe to re-run — it never overwrites existing config)
bar init --dir .

# 3. Find a session transcript you already have
ls ~/.claude/projects/*/*.jsonl

# 4. Ingest it — no API calls, no key, nothing leaves your machine
bar ingest .bar/ambient.sqlite ~/.claude/projects/<project>/<session>.jsonl

# 5. Render the deterministic report
bar report .bar/ambient.sqlite --out .
Open the generated .html file. That's your report.
One-script version: ./run.sh <session.jsonl> — see RUN.md for the full command
reference, or the plain-language walkthrough if you'd rather read a
story than a command list.
How does BAR Observatory work?
Four stages, one local SQLite file per run, and a render path with no model in it: 1. Capture (hooks + transcript, no network) → 2. Store (one local SQLite file) → 3. Render (turn it into JSON/HTML/Markdown, no LLM involved) → 4. Query (ask it questions directly, by hand or via your AI agent). The same flow, as a diagram:
flowchart LR
    subgraph SOURCES["Sources"]
        T["Session transcript<br/>always on, no API calls"]
        H["Lifecycle hooks<br/>21 events"]
        P["Proxy / OTLP<br/>optional, opt-in"]
    end

    subgraph STORE["Your machine, your data"]
        DB[("Local SQLite<br/>one file per run")]
    end

    subgraph OUT["Same DB in, identical bytes out"]
        J["report.json"]
        HT["report.html"]
        M["report.md"]
    end

    T --> DB
    H --> DB
    P -.-> DB
    DB --> J
    DB --> HT
    DB --> M
    DB --> Q["bar query / bar doctor"]
    DB --> MCP["bar-mcp — 12 tools for your AI agent"]
Two front doors, one source of truth. A human-friendly CLI and an agent-friendly MCP server read the exact same local database — neither one is the "real" one; they're just two ways to ask the same honest record a question.
Step-by-step walkthrough of the whole pipeline, each stage shown with a real re-rendered example: Init · Config · Database creation · Ingestion · Optional modules · Sample report · Use cases
What does a BAR Observatory report contain?
Rendered from a real, multi-thousand-turn Claude Code transcript — never a hand-authored mock. Live samples ship in examples/deterministic/ and are re-rendered as the project evolves, so they can't drift from what the code actually does.
| Section | What it answers |
|---|---|
| Task ledger | What work was attempted, in what order, and how it resolved |
| Tool usage | Which tools the agent leaned on, and how hard |
| Sub-agent dispatches | What was delegated, and to whom |
| Rework hotspots | Where the agent burned effort re-doing the same work |
| Failures + remediation | Every error result, with its exact position and text |
| Validation evidence | Which checks actually ran |
| Cost estimate | Token-equivalent cost — or an honest "cost not recorded" if that channel wasn't captured |
| Capture-channel honesty | Which channels had data and which were blind spots |
A trimmed excerpt from a real captured session:
$ bar query <session>.sqlite errors
seq   tool  excerpt
----  ----  -----------------------------------------------------------------
308         MCP server "…brain…" tool "search" timed out after 60s
316         search error: worker timed out after 240s on tools/call
389         MCP server "…brain…" tool "search" timed out after 60s
436         Exit code 143 … (a killed long-running command)
1391        <tool_use_error> Blocked: sleep 90 … (a guardrail refusal)
25 error results surfaced in that one session — timeouts, a killed command, a guardrail refusal — each still queryable months later. Nothing was swallowed.
The same session, in report.md — rendered, not written by hand:
### Key findings

- **25 tool error(s) were captured — the failures are recorded, not swallowed.**
- **One file absorbed the most churn: 157 edits.**
- **Validation was not fully green at capture end: 20 failing vs 99 passing.**
  - From real `test result:` lines in the tool outputs (measured, not self-reported).
- **5 of 6 capture channels were not recorded this session.**
  - Uncaptured channels read "not recorded" (never a fabricated 0) — this is a transcript-only ingest.
And the same fact pair in report.json — the machine contract behind both:
{
  "rework": {
    "events": [{
      "type": "repeated_edit",
      "confidence": "exact",
      "detail": "./…/report.rs edited 157 times",
      "evidence_refs": ["transcript:edit:./…/report.rs"]
    }]
  },
  "capture": {
    "channels": [{
      "id": "requests",
      "status": "not_recorded",
      "recorded": 0,
      "reason": "No requests rows in this store."
    }]
  }
}
Three formats, one database, same facts — that not_recorded status with its own stated reason
is the JSON version of the not_observed rule running through every other format.
That same session, in numbers — all from the one real report in examples/deterministic/real-session.report.json, nothing rounded up:
| Metric | What it means |
|---|---|
| 27 | tasks in the session (12 completed, 15 still open or superseded) |
| 25 | tool error results — every one surfaced, not just the ones that got fixed |
| 603 / 293 / 98 | calls to the agent's Bash / Edit / Read tools — the raw shape of the work |
| 157 of 293 | edits landed in a single file (report.rs) — a signal about the spec, not the agent |
Two things this table deliberately does not claim: a commit count, and a count of unnecessary wait/sleep cycles. Neither is a channel this report captures yet — see what BAR Observatory does not see.
The .html view of that same report — this is what opens when you run bar report:
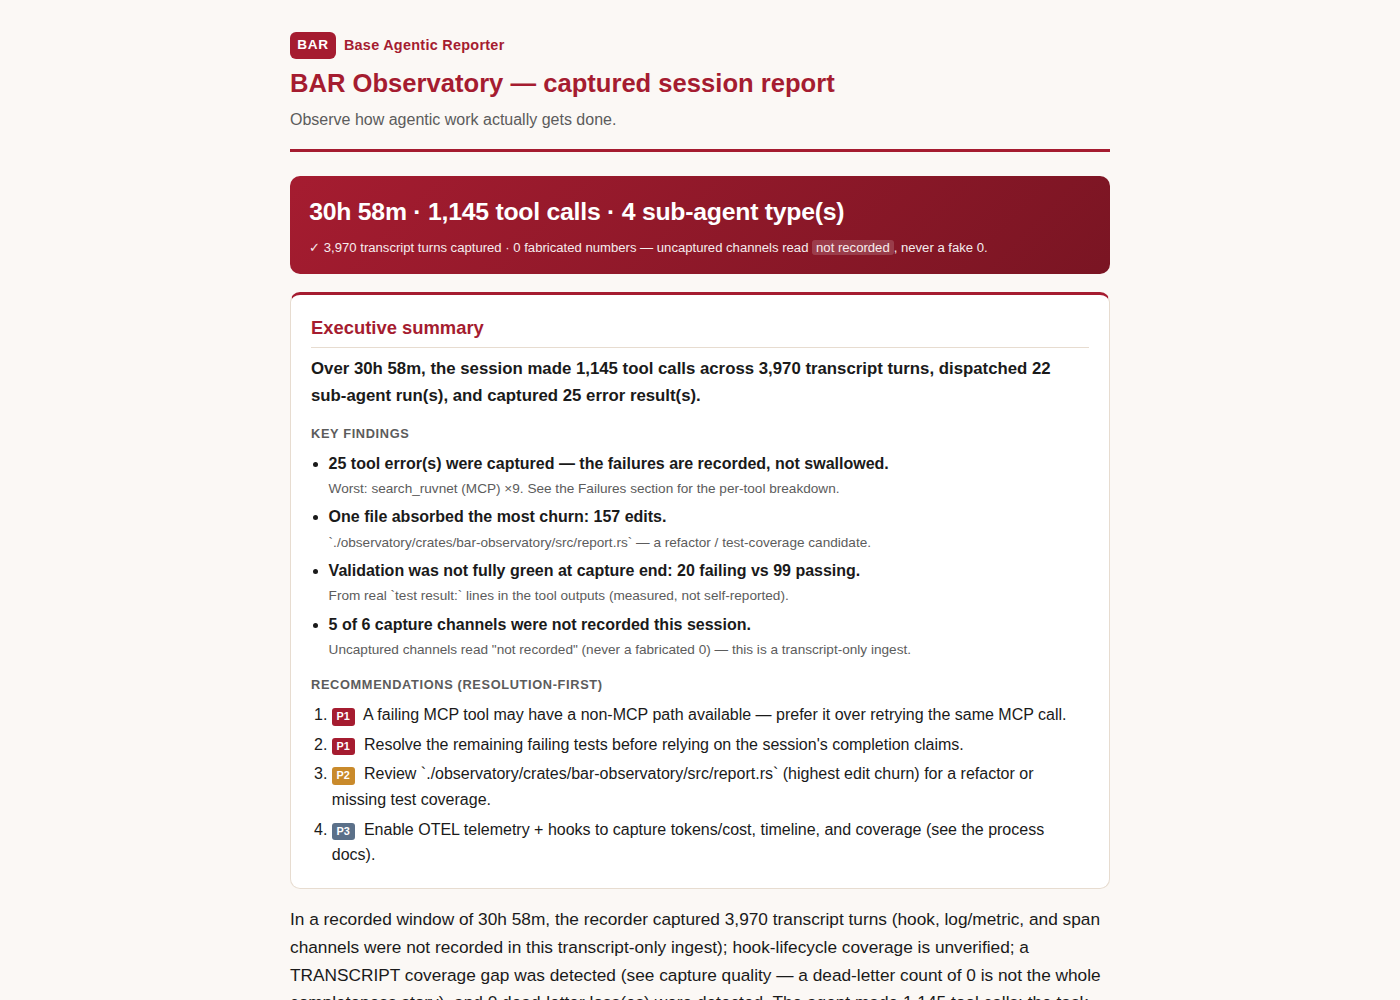
Full file: examples/deterministic/real-session.report.html — open it yourself, no setup needed. Section-by-section annotated walkthrough of what's in it and why: wiki/human-html/report-guide.html.
At a glance
| Metric | Value |
|---|---|
| Engine | 14 focused bar-* crates behind a thin bar CLI facade |
| Published to crates.io | 15 crates (CRATES.md) |
| Lifecycle hooks wired | 21 |
| MCP tools for agents | 12, all read-only |
| Slash commands | 5 |
| Output formats | 3 (JSON · HTML · Markdown) from one database |
| Network calls, primary path | 0 |
| LLM calls in the render path | 0 |
| Tests passing | 543, verified at publish time |
| Storage | One local SQLite file per run — portable, queryable, yours |
| Determinism | Same DB in → byte-identical bytes out, across all three formats |
| Report contract | Typed JSON output (report.json); a versioned schema for it ships in schemas/ but is currently out of sync with the live report shape — disclosed, not silently wrong |
| Integrity | checksums/SHA256SUMS.txt + provenance/PROVENANCE.json |
| Language / License | Rust · MIT |
How is BAR Observatory different from Langfuse, SigNoz, or a live dashboard?
Most tools in this space answer "what is happening right now?" BAR Observatory answers "what happened, and can I prove it later?" Those are different jobs, and the tools compose.
| Dimension | BAR Observatory | Live dashboards | OTel backends (SigNoz, OpenObserve, Dash0) |
LLM eval platforms (Langfuse, Phoenix, Arthur, AgentOps) |
Raw .jsonl + jq |
|---|---|---|---|---|---|
| What it is | Post-hoc audit report / receipt | Real-time event stream UI | Trace & metric backend | Trace + evaluation platform | Your own scripts |
| Where data lives | Local SQLite, one file per run | Local, live-streamed | Collector → server / SaaS | Self-hosted or SaaS service | Local files |
| Needs a server or daemon | No | Yes | Yes | Yes | No |
| Works on sessions already finished | Yes — parses transcripts on disk | No — must be running | No — must be exporting | No — must be exporting | Yes |
| Reproducible artifact | Byte-identical, every time | Ephemeral view | Query-time view | Query-time view | Whatever you wrote |
| Absence handled honestly | not_observed, never a fake zero |
Varies | Typically gaps or zeros | Varies | Up to you |
| Readable by your AI agent | Yes — MCP, 12 read-only tools | Rarely | Via backend API | Via API | Via shell |
| Setup cost | A few commands, no server to run | Install + run server | Collector + backend config | Account + SDK wiring | Hours of your time |
| Best for | Audit, review, PR evidence, retros, compliance | Watching a run unfold | Fleet-scale metrics across many runs | Model/prompt evaluation | One-off spelunking |
Comparison reflects the general design posture of each category, not an audited feature list of any specific product — individual tools evolve; check their own docs for specifics. Longer version: wiki/human-md/comparison.md.
Why choose BAR Observatory
- Deterministic, not vibes-based. The render path is a pure function of the database. Re-run it a year from now and get the identical bytes.
- Honest about gaps. An uncaptured channel is reported as
not_observed, never a fabricated zero. If BAR Observatory doesn't know, it says so — including in this README. - Retroactive. Every other tool requires you to have already been recording. BAR Observatory works on the transcript already sitting on your disk.
- Local-only by construction, not by promise. Zero egress on the primary path, verifiable from the source (MIT licensed). No API key, no account, no telemetry about your telemetry. Regulated and air-gapped use: wiki/human-md/enterprise.md.
- Built for agents as first-class readers. The MCP surface means your agent can audit its own last session without you copy-pasting anything.
Not a replacement for: fleet-scale dashboards, prompt/model evaluation, or live monitoring. If you already run a dashboard or an OTel backend, BAR Observatory sits beside either one as the per-run evidence layer.
Two ways to generate, two audiences, one database
bar report is one report — there's no audience flag on it, and there doesn't need to be, because
the same calculated facts read differently depending on who's looking. bar interpret genuinely
does have two modes (--audience executive|engineering), since writing prose for a different
reader is exactly the kind of judgment call the deterministic layer refuses to make:
Calculated (bar report — one report, no AI, $0.00, byte-identical every time) |
Interpreted (bar interpret --audience … — optional, LLM-written) |
|
|---|---|---|
| Read by a client or manager | A consulting-style memo: what was delivered, what it cost, what risks surfaced | --audience executive: what the numbers mean and what needs deciding |
| Read by you or whoever maintains this | The technical record: chronological timeline, every failure with its position, rework hotspots | --audience engineering: why the run went the way it did, and what to change next time |
The calculated column is the same document in both rows — it's the reading, not the report, that changes. The interpreted column is commentary on that evidence, always labeled as such, and the evidence never depends on it existing.
A real --audience executive output — the disclaimer at the top is part of the actual page, not
added for this screenshot:
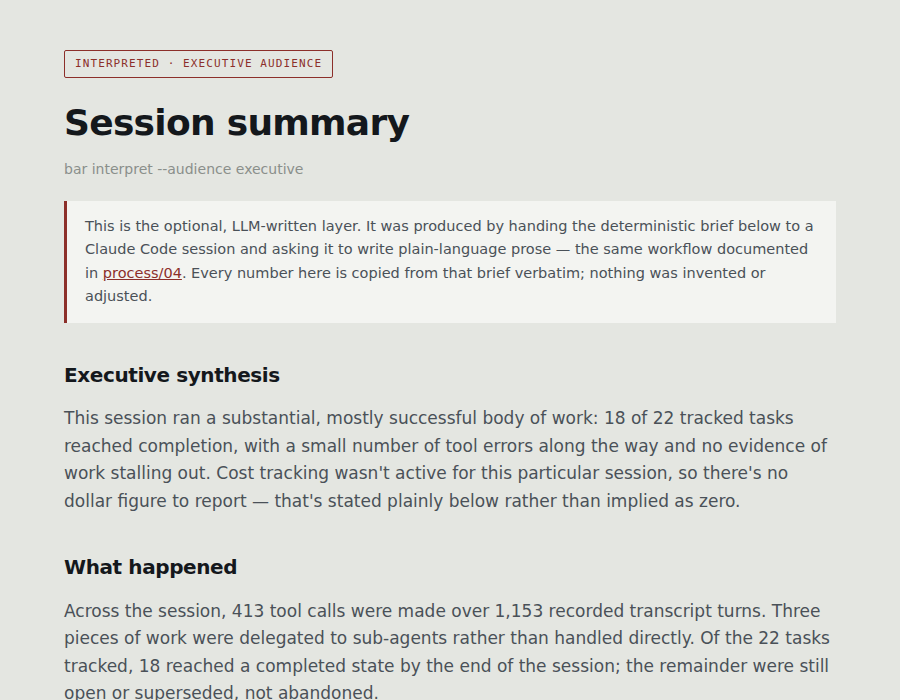
Full file: examples/interpreted/interpreted-executive.html — and the real brief it was written from, unedited: interpret-brief.executive.md.
Core use cases
"What did my agent actually do in that session?"
bar report (or /bar-report) gives you the full task ledger, tool usage, and sub-agent
dispatches from the actual record — not the agent's own end-of-session summary.
"What silently failed?"
bar query <db> errors (or /bar-query) surfaces every error with its exact position and text.
Still queryable months later.
"Where did my agent burn effort re-doing work?"
Rework hotspots show which files and tasks the agent circled back to — a useful signal for where your prompts, specs, or context may have been underspecified.
"What did that run cost?"
A cost estimate when the token channel was captured, and an explicit "cost not recorded" when it wasn't.
"Can I attach proof of AI work to a pull request?"
The .md report is diff- and review-friendly; the .html is the shareable human view; the
.json is schema-validated for pipelines. All three render from the same database, so they
always agree.
"Can my AI agent audit its own last session?"
Point it at bar-mcp and it queries tools, timeline, errors, and more directly — the foundation
of a self-improvement loop grounded in what actually happened, not what the agent believes
happened.
"Is my recorder even working?"
bar doctor (or /bar-doctor) reports plainly which channels had data and which were blind
spots — check the instrument before you trust the reading.
"How do I get an audit trail for AI-assisted work?"
One durable, reproducible database file plus a schema-validated report per run, generated with zero data leaving the machine — a structured record you can include in your own audit or review process. (Reports are reproducible, not cryptographically signed per run — check with your compliance team on what your specific evidentiary requirements are.)
For AI agents: read your own session over MCP
claude mcp add bar-observatory -- bar-mcp --db-root .bar
Twelve read-only tools. Call get_hub first — it routes an agent to everything else in the
record. Most tools read one run's capture database, but five are explicitly cross-run — they scan
every database under --db-root, not just the one you point at: list_runs and
compare_conditions (aggregate ledgers across every run when called without a db argument),
plus search_observations, list_findings, and recall_context (always read the cross-run
index, never a single database). That's the foundation for an agent starting a new session to ask
"what did previous runs already try" before repeating it.
Full tool list and ground rules: wiki/agent/AI-CONTEXT.md
Who is this for?
A good fit if you:
- Run long or autonomous Claude Code sessions
- Want a record of AI work for review, retros, or an internal audit trail
- Debug multi-agent runs where failures hide inside sub-agents
- Care that nothing leaves your machine
- Want your agent to reason about its own execution history
- Are a manager or client who wants a verifiable record, not just a summary — see the executive/client guide
- Are new to reviewing AI-written code and want a habit for checking it before you merge — see the junior developer guide
Probably not what you want if you:
- Need a live dashboard while a run is in progress
- Want fleet-scale aggregation across hundreds of runs and many machines
- Are evaluating prompt or model quality rather than execution behavior
- Aren't using Claude Code
What does BAR Observatory not see?
Stated plainly, because a measurement instrument that hides its blind spots isn't one. The single distinction underneath everything in this section:
0 failuresmeans BAR Observatory looked at the evidence and found none.not_observedmeans BAR Observatory didn't have enough evidence to make that claim at all.
Those are different statements about the world, and collapsing them into one is how a monitoring tool quietly starts lying to you.
- Model-side delivery failures are invisible. A real finding from building this documentation: some tool results failed to reach the model's context (an "internal error") yet were recorded correctly server-side (full output, marked successful). BAR Observatory reads the session transcript — server-side truth — so a delivery failure to the model doesn't appear there. Disclosed as a candidate future detector, not swallowed.
- Uncaptured channels are reported as
not_observed. If the token channel wasn't captured, the report says "cost not recorded" rather than$0.00. - Optional modules are off by default. Proxy and OTLP capture add channels but are opt-in; the always-on path is transcript parsing.
FAQ
Does BAR Observatory send my code anywhere?
No. The primary path — parsing a transcript already on your disk — makes zero network calls. There is no account, no API key, and no telemetry. Everything is a local SQLite file on your machine, and the source is MIT-licensed so you can verify the claim rather than trust it. For exactly what ends up in that local file — including that it stores real message text and the agent's thinking blocks, not just counts — see what data actually gets stored.
Do I need an Anthropic API key?
No. Nothing in the capture, storage, or render path calls a model.
Do I need to know how to code?
No — the plugin's slash commands (/bar-init, /bar-report, etc.) don't require any programming
knowledge. You will need to type a couple of terminal commands once during setup (or have a
technical teammate do that one-time step); the plain-language guide walks
through exactly what to type, including how to open a terminal if you've never done that before.
Can I report on sessions I already ran?
Yes — and this is the fastest way to try it. Point bar ingest at any Claude Code transcript
already on disk and render a report immediately, with no recorder having been active at the
time.
Where does Claude Code store session transcripts?
Under your ~/.claude/ directory, one .jsonl file per session, organized by project.
ls ~/.claude/projects/*/*.jsonl will list them.
What does "deterministic report" actually mean?
The render path is a pure function of the capture database: no model, no clock-dependent values, no network. The same database renders byte-identical JSON, HTML, and Markdown today and a year from now — which is what makes the report usable as evidence, not just a snapshot.
What does not_observed mean?
That BAR Observatory had no data for that channel and is telling you so, instead of showing a zero you might mistake for a real measurement. Absence is reported as absence.
Is this a replacement for Langfuse, SigNoz, or OpenTelemetry?
No — it's a different job. Those answer "what is happening across my fleet right now." BAR Observatory answers "what happened in this run, provably." Many teams run both. See the comparison table.
What's the difference between bar report and bar interpret?
bar report is the deterministic layer — no LLM, byte-identical output, safe to treat as
evidence. bar interpret is the optional interpreted layer that produces a plain-English
self-improvement writeup (engineering or executive framing). The deterministic report never
depends on it.
Does it work on Windows, Mac, and Linux?
Yes — it's a standard Rust program with no OS-specific dependencies in the core path. All three
platforms are supported by cargo install.
Will this ever cost money?
No. It's MIT licensed today and that doesn't change retroactively — any version you have stays free forever, and the project has no paid tier.
Does this work with AI agents other than Claude Code?
The transcript-parsing path is built specifically around Claude Code's session format. It isn't built for other agent tools today; if that changes, it'll be stated plainly here, not implied.
Is BAR Observatory affiliated with Anthropic?
No. It's an independent open-source project, built for Claude Code but not endorsed by or affiliated with Anthropic.
How do I get help or report a problem?
Open an issue. Security reports go through SECURITY.md. Contributions: CONTRIBUTING.md.
Architecture and crates
BAR Observatory is a thin bar CLI (crate bar-observatory) over a 14-crate bar-* engine — a
SQLite substrate (bar-store), a cross-run index (bar-index), a transcript parser
(bar-ingest), a read-only query surface (bar-read), the typed report contract (bar-schema),
the metrics ledger (bar-metrics), the reflection engine (bar-review), the MCP server
(bar-mcp), and more.
CRATES.md has the full list, each crate's role, and a live crates.io link. Crates publish incrementally in dependency-tier order — a link means cleared for publish, not necessarily live yet.
Crate source lives and publishes from a private working repo; this repository is the front door, documentation, and plugin — no crate source here, by design.
Deeper technical material: wiki/human-md/architecture.md. This project's docs are also written in three registers (human / AI / AISP) for three different readers — why, what's hand-maintained versus generated today, and a live tab switcher between the three: wiki/human-html/documentation-layers.html. Section-by-section walkthrough of what a report actually contains, quoting the real example: wiki/human-html/report-guide.html.
Repository map
| Path | What's in it |
|---|---|
| process/ | Step-by-step pipeline walkthrough (start here for the technical tour) |
| examples/ | Real, current sample reports — open right now, no setup needed |
| schemas/ | The report contract as JSON Schema |
| config/ | Default settings |
| .claude-plugin/, commands/, hooks/ | The Claude Code plugin |
| wiki/ | Deeper docs, organized by reader — see wiki/README.md for the map, or wiki/README.html for the same ground as one long page with a Human/Advanced/AISP reading-mode switch. Includes the plain-language human guide, the AI agent guide, comparison, enterprise/offline use, architecture, why the docs come in three registers, what's in a report, and guides for executives/clients and junior developers |
| checksums/, provenance/ | Integrity and build provenance |
| RUN.md · CRATES.md · CHANGELOG.md | Command reference · crate index · release history |
| llms.txt | A curated, machine-readable index of this repo's docs, for LLMs and crawlers |
Recommended reading
Every link below already shows up somewhere else on this page — this section exists because "it's in here somewhere" isn't the same as "start here," and the honest answer to "what should I read next" depends entirely on who's asking. Pick your row.
The human wiki, in HTML — pick your seat
You're leading a team, advising a client, or signing off on the budget. Read the executive / client guide first and stop there unless something in it makes you curious. It's written to answer "can I trust this without reading code," not to teach you the tool.
You're an advanced agentic engineer, probably already running your own swarms. Why the docs come in three registers and what's actually in a report are the deep-dive human pages — written for someone who already knows what a tool-call trace is and won't be offended by an architecture diagram. But if you're about to point an agent at this project instead of reading it yourself: don't hand your swarm these two. Hand it the AI agent guide and the AISP capability registry instead — those are written natively for a machine reader, not translated down from human prose for one, and your agents will get more signal per token from the real thing.
You're a software developer and you just want the whole technical tour. wiki/README.html is the entire wiki as one page, with a working Human / Advanced / AISP reading-mode switch built in — the "stop making me click through folders" option. If you're specifically new to reviewing AI-written code (as opposed to writing it), the junior developer guide is a shorter, habit-focused detour worth taking first.
The wiki in Markdown, if you'd rather read than click
- wiki/human-md/README.md — the plain-language, click-along setup guide. Start here if you've genuinely never opened a terminal; it doesn't assume you have.
- wiki/human-md/architecture.md — crates, determinism, absence semantics. The reference page for "how does this actually work."
- wiki/human-md/comparison.md — the longer version of the Langfuse/SigNoz/dashboard comparison table above, for when the table alone isn't enough to decide.
- wiki/human-md/enterprise.md — security, compliance, and air-gapped use, including the specific, narrow list of what gets redacted (and the honest admission of what doesn't).
Glossary
- Receipt — a report where every claim resolves to a real, recorded fact in the capture database.
- Deterministic render — output that is a pure function of its input database; no model, no network, no clock.
not_observed— an explicit absence state; the instrument had no data and says so. See the FAQ for the full explanation.- Capture channel — one source of session facts (transcript, hooks, proxy, OTLP).
- Rework hotspot — a file or task the agent returned to repeatedly, signaling wasted effort.
- Capture DB — the local SQLite file holding one run's observations.
- AISP — a separate, author-created symbolic specification language for precise AI-to-AI
instructions. Used in this project only as an optional annotation layer on agent-facing docs
(wiki/aisp/HUB.aisp); never a runtime dependency of
bar. See wiki/human-html/documentation-layers.html for the full explanation.
Project status
Version 0.1.0 across 14 of the 15 crates (bar-mcp is at 0.1.1, one patch ahead after a
documentation fix) — the first public release. This is an early, actively
maintained project: the core pipeline (init → ingest → report → doctor → interpret → query) and
the MCP server are complete, tested (543 tests passing), and verified working end-to-end,
including a genuine from-scratch install from crates.io. What's still moving: the plugin's
binaries currently resolve via PATH rather than a bundled per-platform download (see the
disclosed gap above) — packaging that up is
the next planned release-engineering work, tracked openly rather than silently deferred.
About the author
BAR Observatory is built and maintained by Bradley Ross, an Agentic Engineer and architect
with 25 years in data science and software engineering, specializing in (near-)deterministic AI
and applied research. He also teaches agentics. The project exists because of a direct need
encountered doing that work: auditing a long, autonomous agent session by scrolling its
transcript doesn't scale, and an agent's own end-of-session summary isn't evidence. That same
insistence on checking the record instead of trusting the summary — sharpened through capstone
and research work at Harvard — is why this project treats determinism, absence-honesty
(not_observed over a fabricated zero), and evidence over narrative as requirements, not
aspirations.
This repository is the open-core edition of BAR Observatory: the same real crates, published to crates.io, wrapped in documentation and guides meant to be usable immediately — install it, point it at a session, and have the wiki explain what the resulting numbers actually mean, rather than leaving you to reverse-engineer a report schema on your own.
Connect: linkedin.com/in/bradaross
Acknowledgements
Thanks to the people and projects that shaped this one, directly or as inspiration:
- ruvnet (Reuven Cohen) — founder of the Agentics Foundation, and the inspiration behind this project's own custom AISP harness.
- QE Fleet — the Agentic QE Framework, created by Dragan Spiridonov, used to help debug this project during development.
- ruvnet-brain — a source-grounded research knowledge base for the RuvNet stack, built by Stuart Kerr, credited for the research behind it.
- AISP — the author's own symbolic specification protocol (AI Symbolic Programming), credited here for precision, spec-driven development with near-deterministic capabilities.
- Harvard — for the capstone and research that shaped this work.
License
MIT — see LICENSE. BAR Observatory is an independent project and is not affiliated with or endorsed by Anthropic. "Claude" and "Claude Code" are trademarks of Anthropic.
This is the open-core edition. Everything in this repository and everything published to crates.io is the complete, unrestricted, MIT-licensed tool — there is no feature gate, no crippled free tier, and no separate paid edition of what you see here. If you want more advanced features, a custom deployment, or a commercial application built on this — contact the author directly. See About the author below.
Установка Bar Observatory
У этого сервера нет опубликованного пакета — он собирается из исходников. Открой репозиторий и следуй инструкции в README.
▸ github.com/bar181/bar-observatoryFAQ
Bar Observatory MCP бесплатный?
Да, Bar Observatory MCP бесплатный — установка в пару кликов через Unyly без оплаты.
Нужен ли API-ключ для Bar Observatory?
Нет, Bar Observatory работает без API-ключей и переменных окружения.
Bar Observatory — hosted или self-hosted?
Self-hosted: сервер запускается локально на твоей машине командой из раздела установки.
Как установить Bar Observatory в Claude Desktop, Claude Code или Cursor?
Открой Bar Observatory на unyly.org, выбери вкладку своего клиента (Claude Desktop, Claude Code, Cursor) и нажми Install — конфиг сгенерируется автоматически, без правки JSON.
Похожие MCP
wenb1n-dev/SmartDB_MCP
A universal database MCP server supporting simultaneous connections to multiple databases. It provides tools for database operations, health analysis, SQL optim
 автор: wenb1n-dev
Postgres Server
This server enables interaction with PostgreSQL databases through the Model Context Protocol, optimized for the AWS Bedrock AgentCore Runtime. It provides tools
 автор: madhurprash
Postgres
Query your database in natural language
 автор: Anthropic
PostgreSQL
Read-only database access with schema inspection.
автор: modelcontextprotocolRedis
Interact with Redis key-value stores.
автор: modelcontextprotocolSQLite
Database interaction and business intelligence capabilities.
автор: modelcontextprotocolmxcp
Open-source framework for building enterprise-grade MCP servers using just YAML, SQL, and Python, with built-in auth, monitoring, ETL and policy enforcement.
 автор: raw-labs
tadas-github/a2asearch-mcp
MCP server to search 4,800+ MCP servers, AI agents, CLI tools and agent skills. Install: npx -y a2asearch-mcp. Ask Claude: "Find MCP servers for database access
 автор: tadas-github
julien040/anyquery
Query more than 40 apps with one binary using SQL. It can also connect to your PostgreSQL, MySQL, or SQLite compatible database. Local-first and private by desi
 автор: julien040
drakonkat/wizzy-mcp-tmdb
A MCP server for The Movie Database API that enables AI assistants to search and retrieve movie, TV show, and person information.
 автор: drakonkat
Compare Bar Observatory with
Не уверен что выбрать?
Найди свой стек за 60 секунд
Автор?
Embed-бейдж для README
Похожее
Все в категории data