
Clausius
БесплатноНе проверенAn MCP server for monitoring and managing multi-cluster Slurm GPU jobs, enabling AI agents to execute commands, check allocations, and explore logs across HPC c

Описание
An MCP server for monitoring and managing multi-cluster Slurm GPU jobs, enabling AI agents to execute commands, check allocations, and explore logs across HPC clusters.
README

clausius
Research clusters are chaotic. We are here to reverse the entropy.
Multi-cluster Slurm dashboard with AI agent integration via MCP.
Monitor, explore, and manage GPU jobs across HPC clusters from a single browser tab —
or let your AI coding agent do it through the built-in MCP server.
Quick Start
git clone https://github.com/tamohannes/clausius.git
cd clausius
pip install flask paramiko

# Initialise the database (creates data/ and the schema)
python -m server.cli setup --non-interactive

# Add your first cluster
python -m server.cli add-cluster my-cluster \
    --host login-node.example.com \
    --gpu-type H100 --gpus-per-node 8 \
    --account my_ppp_account \
    --mount-path /shared/storage/$USER

# Start the server
python app.py
Architecture
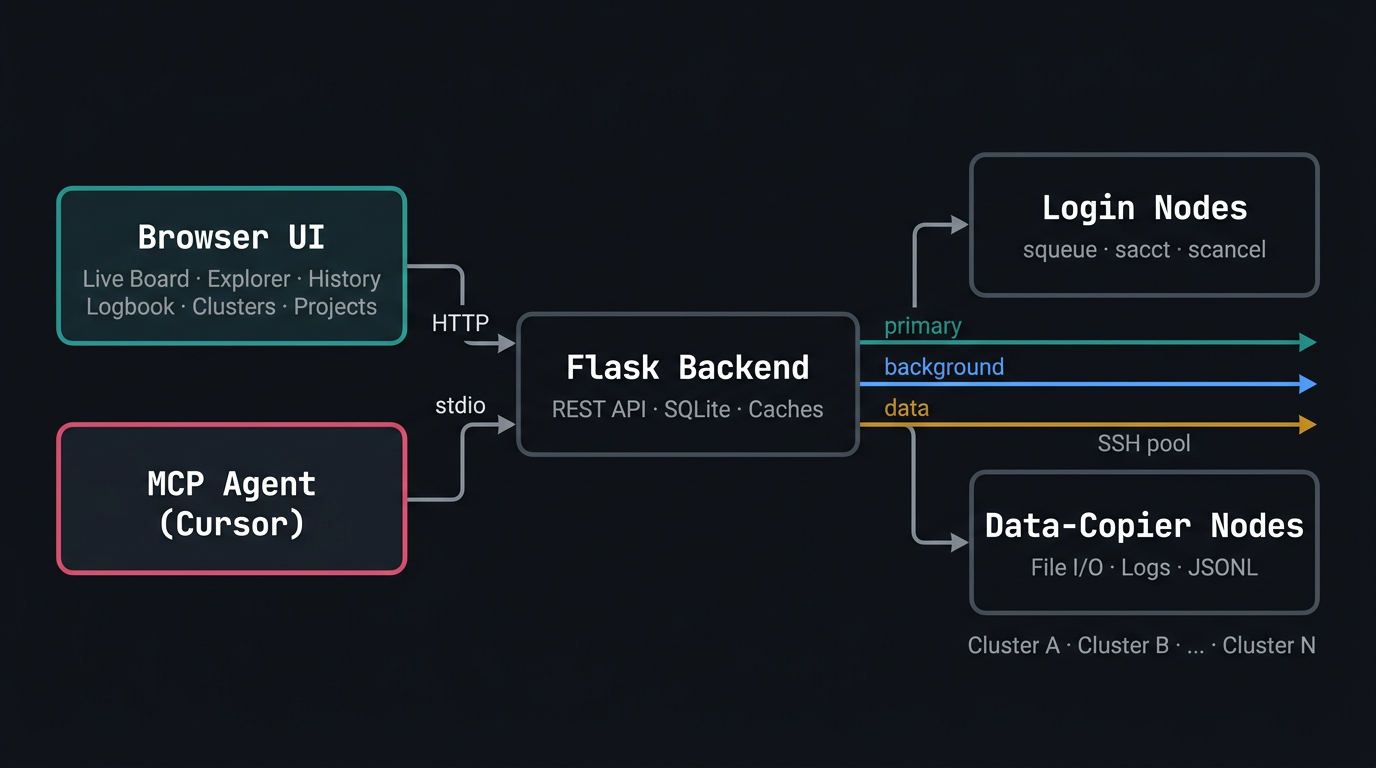
Three-lane SSH connection pool: primary (Slurm control), background (metadata), data (file I/O routed to data-copier nodes with automatic login-node fallback). AI Hub OpenSearch integration for formal GPU allocations and fairshare data.
All runtime configuration lives in the SQLite database (data/history.db). The only file-based config is a tiny bootstrap TOML for the four values needed before the DB is reachable (data directory, port, SSH defaults). Everything else is managed through three equivalent interfaces:
| Interface | Example |
|---|---|
| Settings UI | Clusters tab, Profile > PPPs, Advanced |
| CLI | python -m server.cli add-cluster eos --host ... |
| MCP tools | add_cluster_config(name="eos", host="...") |
Features
Live Board
- Multi-cluster job board grouped by run name (active, idle, unreachable, local)
- Slurm dependency chain detection with topological sorting
- Persistent run grouping — completed jobs retain their dependency structure
- Live progress tracking, crash detection (OOM, segfault, traceback)
- Cluster availability tooltip with wait-time estimates, pending reason translation, and team fair-share priority
- Board-pinned terminal jobs persist until dismissed
- Background job dimming for long-running server processes (configurable suffixes)
- Per-GPU utilization and memory charts, CPU utilization, RSS memory tracking
- Configurable GPU stats snapshot interval
Log Explorer
- Mount-first reads with SSH fallback to data-copier nodes
- Nested directory browsing with lazy-loaded tree
- Syntax-aware rendering for
.json,.jsonl,.jsonl-async,.md - Full log pagination, JSONL record viewer, clipboard copy
History
- SQLite-backed job history with dependency-aware grouping
- Text search, state filters (completed/failed/cancelled/timeout/running/pending)
- Paginated view with configurable page size
Projects
- Auto-detected projects from job name prefixes
- Per-project detail pages with live jobs, stats, and search
- Customizable project colors and emojis
Logbook
- Per-project structured entries with BM25 full-text search (FTS5 with porter stemming)
- Two entry types: note (experiments, debugging, findings) and plan (implementation/research plans)
- Full markdown support: tables, code blocks, blockquotes, links
@run-namereferences to link to job logs#idcross-references between entries (rendered as clickable links with title resolution)- Drag/drop and paste image uploads
- HTML file embeds for interactive figures (plotly, bokeh, matplotlib exports)
@autocomplete for run names in the editor- Entry IDs displayed in sidebar and detail view for agent communication
Logbook Map
- Visual map of entry relationships built from
#idcross-references - Tree view: hierarchical layout with connector lines, sorted by edit time
- Graph view: static DAG layout with D3.js, curved directed edges, zoom/pan/drag
- Entry-centric graph: open from any entry's detail page with configurable neighbor depth (1-5 hops or all)
- Edge direction filter: show outgoing, incoming, or both connections
- Focus controls shared between tree and graph views
- Color-coded nodes: neutral for notes, red for plans (matching sidebar)
Compute (GPU Allocations & Cluster Intelligence)
- GPU Allocations Dashboard: Per-cluster cards showing formal PPP allocations, consumption, and fairshare from AI Hub OpenSearch
- Stacked usage bars: Side-by-side segments — your running/pending (accent, striped), team running/pending (orange, striped), PPP non-team (gray) — with toggle controls
- "Where to Submit" strip: Ranked cluster chips scored by team-aware headroom (considers informal team quota, PPP fairshare, and current usage)
- Hover popup: Per-account breakdown with your usage, team, PPP non-team, other PPPs, cluster total, and team alloc
- Click-through modal: Full per-user GPU breakdown with running/pending/CPU counts, sorted by usage
- GPU Usage History: Chart.js time-series of allocation vs consumption per account with 7d/14d/30d range selector
- Pending job tooltips: Fairshare-based wait estimates using AI Hub
level_fs, plus cross-cluster recommendations filtered by job size and GPU type - Mounts: SSHFS mount/unmount/remount per cluster; mount-all in parallel with progress; stale mount detection via
/proc/mounts(never blocks on dead FUSE) - Storage Quotas: Lustre filesystem and PPP project quotas
Settings
- Profile: Avatar, username, team name, PPP quota list
- General: Theme (system/light/dark), auto-refresh toggle, refresh interval
- Shortcuts: Configurable keyboard bindings (toggle sidebar, spotlight, close/next/prev tab, refresh live data)
- Clusters: Add/edit/remove clusters, mount controls with restart button
- Projects: Prefix, color, and emoji customization
- Advanced: SSH timeout, cache freshness, GPU stats interval, database backup interval and retention, history page size, JSONL record limits, background run suffixes, local process include/exclude filters
UI
- Multi-tab interface with persistent tab state across sessions
- Collapsible sidebar with draggable width
- Spotlight search (Cmd+P): search across projects, logbook entries, and job history
- Loading toasts with animated progress bar for all async actions
- Theme-aware color system with CSS custom properties
- Keyboard shortcuts: Cmd+Shift+R (refresh live), Cmd+S (toggle sidebar), Cmd+P (spotlight), Cmd+W (close tab), Cmd+]/[ (cycle tabs)
- Charts: per-GPU utilization/memory line charts, CPU utilization, RSS memory (Chart.js)
- D3.js for interactive logbook graph visualization
Database Backups
- Automatic daily backups using SQLite online backup API (safe during writes)
- Configurable backup interval (default: 24 hours) and retention (default: 7 backups)
- Stored in
data/backups/history-YYYY-MM-DD.db - Old backups automatically cleaned up
MCP Server (AI Agent API)
- Standalone local Streamable HTTP MCP server (recommended for Cursor and other MCP-compatible agents)
- 49 tools covering every aspect of the dashboard:
| Category | Tools |
|---|---|
| GPU Allocations | where_to_submit, get_ppp_allocations, get_gpu_usage_history |
| Jobs | list_jobs, get_job_log, get_job_stats, list_log_files |
| History | get_history, list_projects, get_project_jobs |
| Actions | cancel_job, cancel_jobs |
| Runs | get_run_info, run_script, cleanup_history |
| Clusters (config) | list_cluster_configs, get_cluster_config, add_cluster_config, update_cluster_config, remove_cluster_config |
| Cluster (status) | get_cluster_status, get_team_gpu_status, get_cluster_availability, get_partitions, get_partition_summary, recommend_submission, get_storage_quota |
| Team | list_team_members, add_team_member, remove_team_member |
| PPP Accounts | list_ppp_accounts, add_ppp_account, update_ppp_account, remove_ppp_account |
| Paths | list_path_bases, add_path_base, remove_path_base |
| Process Filters | list_process_filters, add_process_filter, remove_process_filter |
| App Settings | get_app_setting, set_app_setting, list_app_settings |
| Mounts | get_mounts, mount_cluster, clear_failed, clear_completed |
| Logbook | list_logbook_entries, read_logbook_entry, bulk_read_logbooks, create_logbook_entry, update_logbook_entry, delete_logbook_entry, search_logbook, upload_logbook_image |
where_to_submit(nodes, gpu_type)— primary tool for "where should I submit this job?" — ranks clusters by team headroom, fairshare, and GPU type matchrun_script()— execute Python/bash on a cluster and return stdout/stderr- Resource:
jobs://summary— quick text overview of running/pending/failed per cluster - Standalone local service, no HTTP hop back into the UI:
clausius-mcp.servicerunsmcp_server.pyas its own user service and exposes FastMCP over Streamable HTTP athttp://127.0.0.1:7273/mcp. Inside that process, MCP still boots the same Flaskappas gunicorn and dispatches each tool throughapp.test_client(). Both processes share SQLite (WAL) andserver.ssh; gunicorn crashes don't take MCP down. - Follower poller: MCP probes the gunicorn
/api/healthendpoint every 10 s and starts the cluster poller in its own process after ~30 s of silence, then steps back as soon as gunicorn answers again. Single-writer work (backups, mount remounts, WDS snapshots, the progress scraper) stays gunicorn-only.
SDK Experiment Tracking (v3)
- NeMo-Skills SDK integration: add
CLAUSIUS_URL=http://<host>:7272to anynscommand to enable tracking - Runs appear on the board in
SUBMITTINGstate immediately, before any Slurm job exists - Lifecycle:
SUBMITTING->PENDING(Slurm accepts) ->RUNNING/COMPLETED/FAILED - Submit command, git commit, hostname, and working directory captured automatically
- Aim-style manual tracking: import
Run, attach to an existing SDK run, store static metadata, and track metric time series - The run metrics explorer is inspired by Aim's Metrics Explorer: metric selection, Python-like search, modifiers, and context tables are adapted for Clausius' single-run workflow.
- Ingest endpoint:
POST /api/sdk/eventswith optional bearer-token auth (sdk_ingest_tokensetting) - If submission fails, the run is auto-marked
FAILEDwith "submission interrupted" - Run popup shows provenance, SDK metadata, latest metric values, metric charts, and recent metric points
Manual metric tracking from code:
from clausius_sdk import Run

run = Run(
    run_name="hle_debug_manual",
    cluster="eos",
    metadata={
        "model": "nvidia/Nemotron-Super-49B-v1",
        "benchmark": "gpqa_diamond",
        "prompt_config": "generic/math",
    },
)

run.track("loss", 0.42, step=1)
run.track("accuracy", 0.84, step=1, context={"split": "eval"})
run.set_metadata({"tokens_to_generate": 32768, "num_chunks": 16})
run.close()
Attach to an existing run created by the NeMo-Skills hooks when you already know its run_uuid:
from clausius_sdk import Run

run = Run(run_uuid="abc123...", connect=True)
run.set_metadata({"judge_model": "gpt-oss-120b"})
run.track("judge_accuracy", 0.71, step=10)
run.close()
Instruction for agents modifying NeMo-Skills:
Instrument this NeMo-Skills code with Clausius SDK tracking.

Use `from clausius_sdk import Run`. If an active Clausius SDK
run UUID is available, attach with `Run(run_uuid=<uuid>, connect=True)`;
otherwise create a new `Run(run_name=<expname>, cluster=<cluster>)`.

Store static experiment metadata with `run.set_metadata({...})`: model,
benchmark/dataset, split, prompt config/template, server type, GPUs/nodes,
num_samples, num_chunks, tokens_to_generate, judge model, sandbox settings,
git/config identifiers, and any run flags that should be searchable later.

Track scalar metrics with `run.track(name, value, step=step, context={...})`.
Use stable metric names such as `accuracy`, `loss`, `pass_at_1`,
`num_generated_tokens`, `empty_generation_rate`, `judge_accuracy`, and
`samples_completed`. Put dimensions like benchmark, split, seed, chunk,
task, or judge in `context`, not in the metric name. Do not log secrets,
tokens, API keys, raw prompts, or huge payloads. Call `run.close()` when done.
Performance
- On-demand architecture: clusters are only contacted when a user or agent requests data
- Three-lane SSH connection pool with data-copier node routing
- Per-cluster caching with configurable TTL
- Prefetch warming for running jobs (log index, content, stats)
- Mount status detection via
/proc/mounts(no filesystem stat, never blocks on stale FUSE) - No background polling — login nodes are not contacted when nobody is looking
Setup
Adding a Cluster
Three equivalent ways to register a cluster:
CLI (recommended for first setup):
python -m server.cli add-cluster my-cluster \
    --host login-node.example.com \
    --gpu-type H100 --gpus-per-node 8 \
    --account my_ppp_account \
    --mount-path /shared/storage/$USER
MCP tool (from your AI agent):
add_cluster_config(
    name="my-cluster",
    host="login-node.example.com",
    gpu_type="H100",
    gpus_per_node=8,
    account="my_ppp_account",
    mount_paths=["/shared/storage/$USER"],
)
Settings UI: Open Settings > Clusters > Add Cluster, fill in the fields.
Bootstrap Configuration
The only file-based config is conf/clausius.toml (optional — clausius boots with sensible defaults if this file is missing). Copy the example to get started:
cp conf/clausius.toml.example conf/clausius.toml
[bootstrap]
data_dir = "./data"     # SQLite DB, backups, logbook images
port     = 7272         # UI listen port

[ssh]
user = "$USER"          # default SSH user for all clusters
key  = "~/.ssh/id_ed25519"
Every field can also be set via environment variable (CLAUSIUS_DATA_DIR, CLAUSIUS_PORT, CLAUSIUS_SSH_USER, CLAUSIUS_SSH_KEY). Env vars always win.
Everything else (clusters, team members, PPP accounts, search paths, process filters, runtime tunables) lives in the SQLite database and is managed through the Settings UI, CLI, or MCP tools.
Database Schema
The canonical schema is in server/schema.py. Key v4 tables:
| Table | Purpose |
|---|---|
clusters |
Cluster registry (host, GPU type, mount paths, team quota) |
team_members |
Team roster for usage overlays |
ppp_accounts |
PPP accounts tracked across clusters |
path_bases |
Log search paths, NeMo-Run output dirs, Lustre mount prefixes |
process_filters |
Local process scanner include/exclude patterns |
app_settings |
Runtime tunables (SSH timeout, cache TTL, backup interval, ...) |
projects |
Project registry with prefixes and colors |
job_history |
Every Slurm job ever observed |
runs |
Logical experiment runs (groups multiple Slurm jobs) |
logbook_entries |
Per-project structured notes with FTS5 search |
Run python -m server.cli setup to create all tables from scratch.
CLI Reference
python -m server.cli setup [--non-interactive]
python -m server.cli add-cluster <name> --host <host> [--gpu-type ...] [--mount-path ...]
python -m server.cli list-clusters
python -m server.cli remove-cluster <name>
python -m server.cli add-team-member <username> [--display-name ...]
python -m server.cli list-team
python -m server.cli add-ppp <name> [--id 12345]
python -m server.cli list-ppp
python -m server.cli add-path --kind log_search <path>
python -m server.cli list-paths [--kind log_search]
python -m server.cli add-filter --mode include <pattern>
python -m server.cli list-filters
python -m server.cli set <key> <value>
python -m server.cli get <key>
python -m server.cli settings
python -m server.cli import-json <path/to/config.json>   # v3->v4 migration
MCP Server
pip install mcp
Install and start the standalone MCP service:
cp systemd/clausius-mcp.service ~/.config/systemd/user/clausius-mcp.service
systemctl --user daemon-reload
systemctl --user enable --now clausius-mcp.service
systemctl --user status clausius-mcp.service
Then add to ~/.cursor/mcp.json:
{
  "mcpServers": {
    "clausius": {
      "url": "http://127.0.0.1:7273/mcp"
    }
  }
}
Reload Cursor (or restart MCP servers) to activate. The web UI service on :7272 can restart independently; the MCP service stays up on :7273.
Cursor Agent Skill
Install the clausius skill so Cursor's agent knows how to use the MCP tools across all your projects:
mkdir -p ~/.cursor/skills/clausius
cp skills/SKILL.md ~/.cursor/skills/clausius/SKILL.md
Migrating from v3
If you have an existing conf/config.json from clausius v3:
python tools/import_legacy_config.py
This imports all clusters, team members, PPP accounts, paths, process filters, and settings into the database and renames config.json to config.json.bak. Safe to re-run — skips entries that already exist.
Environment Variables
| Variable | Default | Purpose |
|---|---|---|
CLAUSIUS_DATA_DIR |
./data |
Override data directory |
CLAUSIUS_PORT |
7272 |
Override listen port |
CLAUSIUS_SSH_USER |
$USER |
Default SSH user for all clusters |
CLAUSIUS_SSH_KEY |
~/.ssh/id_ed25519 |
Default SSH key for all clusters |
CLAUSIUS_BOOTSTRAP_FILE |
conf/clausius.toml |
Override bootstrap config path |
CLAUSIUS_MOUNT_MAP |
(auto) | JSON map of cluster -> mount roots |
Job Name Prefix Protocol
Jobs are grouped by project using a name prefix convention:
<project>_<campaign>_<run-details>
| Component | Rules | Example |
|---|---|---|
<project> |
Lowercase letters, digits, hyphens. Starts with a letter. | my-project, eval-suite, training |
_ |
Required underscore separator | |
<campaign> |
Groups related runs visually (distinct shade of project color) | mpsf, eval, train |
_ |
Second underscore separator | |
<run-details> |
The experiment/eval name | nem120b-r9, kimi-k25-no-tool-r22 |
The monitor auto-detects projects on first encounter, assigning a color and emoji. Customize in Settings > Projects.
Dependency chain auto-detection from run name suffixes:
*-judge-rs<N>— linked as child of the base eval*-summarize-results— linked as child of the judge run
Systemd (User Service)
[Unit]
Description=clausius — Research clusters are chaotic. We are here to reverse the entropy.
After=network.target

[Service]
Type=simple
WorkingDirectory=%h/clausius
ExecStart=%h/miniconda3/bin/python %h/clausius/app.py
Restart=always
RestartSec=5
TimeoutStopSec=10
KillMode=mixed

[Install]
WantedBy=default.target
systemctl --user daemon-reload
systemctl --user enable --now clausius.service
Testing
898 tests across unit, integration, MCP, and CLI layers.
pip install pytest pytest-cov
pytest -m "not live"         # all deterministic tests (no SSH, no cluster)
pytest -m unit               # unit tests only
pytest -m integration        # Flask test client with mock cluster
pytest -m mcp                # MCP tool contracts
pytest -m live               # real cluster tests (requires running app)
| Layer | Directory | What it covers |
|---|---|---|
| Unit | tests/unit/ |
Bootstrap, schema, CRUD (clusters, team, paths, settings), parsers, DB ops, cache, mount resolution, config proxies, entry refs |
| Integration | tests/integration/ |
All Flask routes via test client (including new per-namespace endpoints), logbook links, storage quota, CLI |
| MCP | tests/mcp/ |
Tool contracts, bulk read, config management, transport errors, edge cases |
| Live | tests/live/ |
Real SSH/Slurm reads + job cancel |
CI runs without any config files — falls back to bootstrap defaults with a mock cluster injected via tests/conftest.py.
Built With
- Backend: Python, Flask, Paramiko, SQLite (FTS5)
- Frontend: Vanilla JS, CSS custom properties, Chart.js, D3.js (no build step)
- Agent API: MCP (Model Context Protocol)
- Infrastructure: SSH connection pooling, SSHFS mounts, systemd
License
MIT
Установка Clausius
У этого сервера нет опубликованного пакета — он собирается из исходников. Открой репозиторий и следуй инструкции в README.
▸ github.com/tamohannes/clausiusFAQ
Clausius MCP бесплатный?
Да, Clausius MCP бесплатный — установка в пару кликов через Unyly без оплаты.
Нужен ли API-ключ для Clausius?
Нет, Clausius работает без API-ключей и переменных окружения.
Clausius — hosted или self-hosted?
Self-hosted: сервер запускается локально на твоей машине командой из раздела установки.
Как установить Clausius в Claude Desktop, Claude Code или Cursor?
Открой Clausius на unyly.org, выбери вкладку своего клиента (Claude Desktop, Claude Code, Cursor) и нажми Install — конфиг сгенерируется автоматически, без правки JSON.
Похожие MCP
Fetch
Web content fetching and conversion for efficient LLM usage.
AWS KB Retrieval
Retrieval from AWS Knowledge Base using Bedrock Agent Runtime.
 автор: modelcontextprotocol
Spring AI MCP Server
Provides auto-configuration for setting up an MCP server in Spring Boot applications.
llm-analysis-assistant
A very streamlined mcp client that supports calling and monitoring stdio/sse/streamableHttp, and can also view request responses through the /logs page. It also
 автор: xuzexin-hz
Compare Clausius with
Не уверен что выбрать?
Найди свой стек за 60 секунд
Автор?
Embed-бейдж для README
Похожее
Все в категории ai