
Devops Agent Networking
БесплатноНе проверенEnables DevOps Agent to troubleshoot VPC networking problems by running live probes (dig, nc, ping, traceroute) via SSM and querying VPC Flow Logs via Athena.

Описание
Enables DevOps Agent to troubleshoot VPC networking problems by running live probes (dig, nc, ping, traceroute) via SSM and querying VPC Flow Logs via Athena.
README
A deployable demo where AWS DevOps Agent autonomously troubleshoots VPC networking
problems (DNS, reachability, port blocks) by calling a custom MCP server that runs
dig / nc / ping / traceroute on an EC2 probe host via SSM - and returns
structured findings the agent reasons over and chains.
It has two complementary halves:
- Live active probes (
resolve_dns,tcp_reachability,ping_host,traceroute_host) - authoritative for problems happening right now. - Historical / forensic evidence (
flow_log_query) - queries VPC Flow Logs via Athena to answer "was traffic ACCEPTed or REJECTed over a past window, from whom, on which port, since when" - the only way to investigate an already-resolved or intermittent incident that the live probes are blind to.
A generic DevOps Agent Skill teaches the agent how to investigate - which half to reach for (live vs forensic) and how to read the verdicts.
Why this exists
DevOps Agent is read-only by design. Its permission guardrail blocks ssm:SendCommand
even if you grant it on the investigation role, so you cannot simply let the agent run
network probes. The AWS-sanctioned path is a custom MCP server: the guardrail does not
govern MCP tools. A tool-router Lambda holds the SSM permission and mediates a FIXED command
set, returning structured JSON.
Architecture
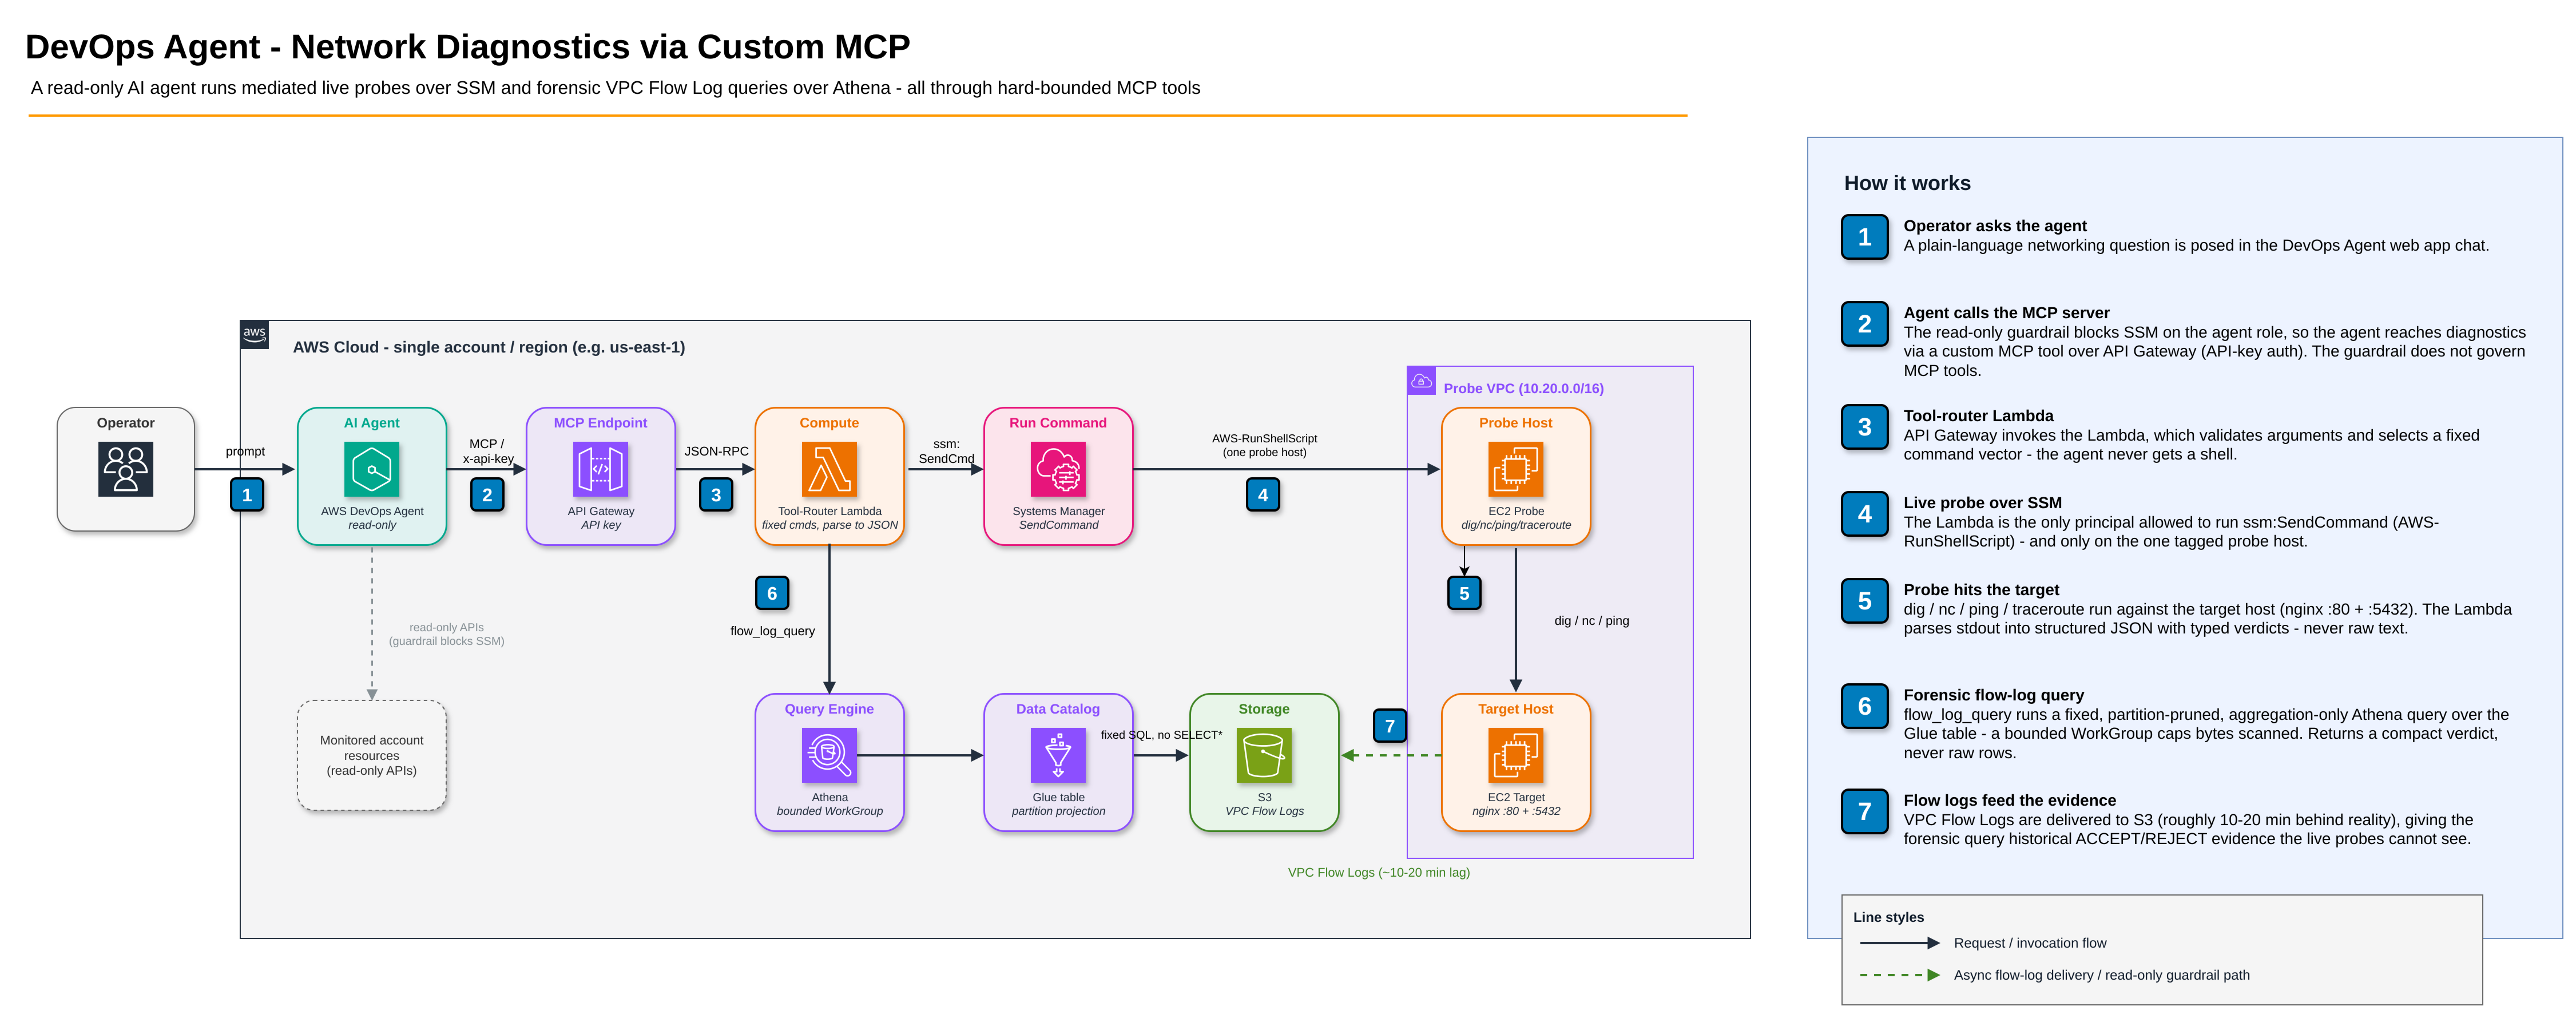
The agent reaches diagnostics through the custom MCP server (the read-only guardrail blocks
ssm:SendCommand on the agent role, but it does not govern MCP tools). The tool-router Lambda holds
the SSM permission and runs a FIXED command set on the single tagged probe host, parsing raw stdout
into structured JSON. For flow_log_query, the same Lambda runs a FIXED, partition-pruned,
aggregation-only Athena query over the VPC Flow Logs (Glue table on S3) inside a bytes-scanned-capped
WorkGroup, and returns a compact verdict - never raw rows.
Four stacks (all in one account / region, e.g. us-east-1):
| Stack | Contents |
|---|---|
NetDiagProbeStack |
VPC, probe host (tools), target host (nginx :80/:5432), Route53 private zone db.corp.internal |
NetDiagFlowLogsStack |
VPC Flow Log (custom format) -> S3, Glue db/table with partition projection, Athena results bucket + WorkGroup (bytes-scanned cap) |
NetDiagMcpStack |
API Gateway + API key + tool-router Lambda (SSM-scoped to the probe host; Athena/Glue/S3-scoped to the flow-logs surface) |
NetDiagAgentStack |
Agent space, agent role (read-only), operator app role, monitor association |
Tools the agent gets (read-only, allow-listed)
Live probes (run a command on the probe host via SSM):
| Tool | Runs | Returns |
|---|---|---|
resolve_dns |
dig |
dns_status, resolved_ip, records, resolver, query_ms |
tcp_reachability |
nc -zv |
verdict OPEN / CONNECTION_REFUSED / CONNECTION_TIMEOUT + remediation hint |
ping_host |
ping -c4 |
reachable, loss_pct, rtt_avg_ms, verdict |
traceroute_host |
traceroute -I |
per-hop list, last_responding_hop |
Historical / forensic (query VPC Flow Logs via Athena):
| Tool | Runs | Returns |
|---|---|---|
flow_log_query |
Fixed, partition-pruned Athena aggregation over VPC Flow Logs | verdict PERSISTENT_REJECT / INTERMITTENT / ALL_ACCEPT / NO_DATA, accept/reject counts, first/last_reject timestamps, top_peers, top_ports |
flow_log_query is flexible across dimensions - filter by any combination of:
ip+direction- pin an endpoint.direction:"to"(default) =ipis the destination (who connects to it);direction:"from"=ipis the source (where it connects to). Resolve a hostname to an IP withresolve_dnsfirst - flow logs record IPs, not names.port- destination port (omit for all ports; useful for port discovery).protocol-TCP/UDP/ICMP(omit for all).action-ACCEPT/REJECT/ALL.window_minutes- look-back window from now (default 60, max 180), orstart_time/end_time- an explicit incident window (ISO-8601 or epoch) to bracket exactly the range a client reported - this yields a clean verdict for the incident instead of blending it with surrounding healthy traffic. The result echoes the actualwindow_start/window_end.
At least one of ip / port / protocol is required so every query stays focused (and cheap).
The query shape is always GROUP BY ... LIMIT with a date-partition filter - the Lambda physically
cannot emit SELECT * or an unbounded scan, and the WorkGroup enforces a hard bytes-scanned cap.
Notes (what is real vs simulated)
- Real: every probe is a genuine command executed on a real EC2 host against a real
target; the packets, timeouts, and RTTs are real. The fault (
seed.sh) is a real security group rule removal - port 5432 is genuinely dropped, not mocked. - Mediated & safe: the agent never gets a shell. Each tool runs a FIXED command vector;
the only agent-controlled values are a validated hostname and port (injection is rejected
before any SSM call). The Lambda is the only principal that can call
ssm:SendCommand, and onlyAWS-RunShellScripton the single tagged probe instance. - Structured by construction: the agent never sees raw stdout - only the JSON the Lambda's
per-command parsers produce (stable
finding_id, typed verdicts), so its reasoning is deterministic and composable. - Flow logs are real and forensic:
flow_log_queryreads genuine VPC Flow Log records delivered to S3. They lag reality by ~10-20 minutes (aggregation + delivery), so a brand-new fault can readNO_DATAuntil records land - this is expected, and it is exactly why flow logs complement rather than replace the live probes. The demo runs 1-minute aggregation for a snappy loop; a production VPC typically runs 10-minute. Because the target has a public IP, flow logs also capture internet scanners hitting it - the tool'stop_peersbreakdown separates the legitimate private source from that public noise.
Prerequisites
Tested on macOS and Linux (the scripts/ are bash and use aws + jq; on Windows use WSL).
| Tool | Version |
|---|---|
| AWS CLI | >= 2.35.9 (aws devops-agent subcommand required; upgrade with the official installer if aws --version is older or aws devops-agent help fails) |
| Node.js | >= 20 |
| AWS CDK | v2 (npm i -g aws-cdk, >= 2.140) |
| Python | 3.12 |
| Docker | any recent (for sam build --use-container) |
| AWS SAM CLI | >= 1.100 |
| jq | any recent |
- An AWS account + a named AWS CLI profile with credentials for it. Set the profile per run
with
PROFILE=<your-profile>(the scripts assert the profile resolves to the expected account before mutating anything). - Copy
.env.exampleto.envand set the target account/region:cp .env.example .env # then edit CDK_PROCESSING_ACCOUNT / CDK_PROCESSING_REGION - Install project dependencies (required once after cloning):
npm install - Bootstrap CDK in your target account/region (required once per account/region, before first deploy):
source .env
cdk bootstrap aws://${CDK_PROCESSING_ACCOUNT}/${CDK_PROCESSING_REGION} --profile <your-profile>
Cost
This deploys billable infrastructure. Running the demo for roughly an hour in us-east-1
is on the order of a few US$; leaving it running costs a few US$/day, dominated by the two
EC2 hosts and the NAT-free VPC. Rough on-demand estimate (verify with the AWS Pricing Calculator
for your region):
| Resource | Rough cost |
|---|---|
2x EC2 t3.micro (probe + target) |
|
| VPC, subnets, Route53 private zone | negligible (no NAT gateway) |
| API Gateway + Lambda | pay-per-use; negligible at demo volume |
| S3 (flow logs) + Glue + Athena | pennies; Athena billed per TB scanned, bounded by a WorkGroup bytes-scanned cap |
| VPC Flow Logs delivery | per-GB; negligible at demo volume |
Charges accrue until you tear down — run scripts/teardown.sh when finished (see below).
Cost-saving tip: if you need to pause between demo runs, you can stop (not terminate)
both EC2 instances to eliminate the compute charge. Stop/start has private IPs preserved
(so db.corp.internal keeps resolving correctly), the SSM IAM policy targets instance IDs (which
never change), and the diagnostic tool binaries and nginx survive on the EBS volume across stop/start.
After starting the instances again, wait ~1–2 minutes before running any scripts or demo prompts — the SSM agent needs some time to re-register after boot. You can confirm both are ready with:
aws ssm describe-instance-information \
  --profile <your-profile> --region <your-region> \
  --query "InstanceInformationList[*].{id:InstanceId,status:PingStatus}" \
  --output table
Both instances should show Online before you proceed.
Run it
Every script requires PROFILE — the AWS CLI profile name for your account. Pass it as a
prefix on each command (or export PROFILE=<your-profile> once in your shell session):
# 1. Build + deploy all four stacks
PROFILE=<your-profile> scripts/deploy.sh

# 2. Register the MCP server with the agent space (API-key auth, all 5 tools allow-listed)
PROFILE=<your-profile> scripts/register.sh

# 3. Install the network-investigation Skill into the agent space (idempotent create/update).
#    Or upload skills/network-connectivity-investigation/SKILL.md manually in the Operator App.
PROFILE=<your-profile> scripts/skill.sh

# 4. Inject the genuine fault (remove the 5432 ingress rule)
PROFILE=<your-profile> scripts/seed.sh

# 5. Preview the tool chain (incl. flow_log_query) + get the investigation prompt
PROFILE=<your-profile> scripts/trigger.sh

# 6. Restore the healthy baseline
PROFILE=<your-profile> scripts/reset.sh

# 7. Tear everything down (deletes the Skill, deregisters MCP server, then cdk destroy)
PROFILE=<your-profile> scripts/teardown.sh
Alternatively, export once and omit the prefix for the rest of the session:
export PROFILE=<your-profile>
scripts/deploy.sh
scripts/register.sh
# ...
Every script verifies the profile resolves to the expected account before mutating anything. All scripts resolve the agent space id, MCP endpoint, API key, and resource names from CloudFormation outputs at runtime - nothing is hardcoded, so a teardown + redeploy (which produces new IDs) works without edits.
Staging the forensic (resolved-incident) scenario
# Seed the fault, generate 'remote client' traffic, reset - then wait for flow-log delivery.
# Leaves the environment HEALTHY with a bounded PAST window of REJECTs only flow_log_query
# can surface. Prints the incident window + an agent prompt.
PROFILE=<your-profile> scripts/scenario-forensic.sh [inject_minutes] [wait_minutes]   # defaults 3, 11
The Skill (investigation methodology)
skills/network-connectivity-investigation/SKILL.md is a generic (not demo-specific)
DevOps Agent Skill that teaches the agent how to investigate VPC connectivity problems:
- Triage first - is the problem happening now (use the live probes) or already
resolved / intermittent (use
flow_log_queryover the reported window, because the live probes are blind to a problem that isn't reproducing)? - A live-probe decision tree (DNS -> ping -> tcp -> traceroute) with verdict interpretation
(e.g.
CONNECTION_TIMEOUT=> suspect a security group/NACL; localize by comparing an allowed port). - A flow-log playbook (direction, port discovery, protocol) and how to read each verdict.
It is methodology over the hard-bounded MCP tools - it steers tool choice, it does not hand
the agent raw SQL, so it adds investigative range without weakening the output guarantees.
Install it with scripts/skill.sh (Asset API) or upload the SKILL.md in the Operator App.
Demo beat 1 - live problem (ongoing)
With the fault seeded, ask the agent (Operator App chat):
A service cannot connect to its database at
db.corp.internalon port 5432. Determine whether the host is reachable, whether DNS resolves, and whether the database port is open. Confirm with the VPC flow logs whether traffic to that port is being rejected and since when. Identify the root cause and recommend a fix.
The agent chains:
resolve_dns (NOERROR -> 10.20.0.x) -> ping_host (ALIVE, 0% loss -> host is up) ->
tcp_reachability:80 (OPEN -> path works) -> tcp_reachability:5432 (CONNECTION_TIMEOUT) ->
flow_log_query to :5432 (PERSISTENT_REJECT if the window is clean, or INTERMITTENT if prior
baseline traffic blended in — either way first_reject timestamps the fault and top_peers
identifies the client IP) => root cause: a security group blocks tcp/5432, corroborated
by the flow logs; it cites the structured evidence and recommends restoring the ingress rule -
no shell. Note: the :80 flow-log query may show a reject from an internet scanner (public IP);
top_peers will confirm the probe has zero rejects on that port.
Demo beat 2 - resolved incident (historical, forensic)
Run scripts/scenario-forensic.sh (seeds, generates client traffic, resets, waits for delivery),
then ask the agent about the past window it printed:
A remote client reported they could not connect to
db.corp.internal(port 5432) a little while ago, roughly between<START>and<END>. It appears to work now. Investigate what happened, confirm whether it was a network issue, and tell me when it started and stopped.
This is the beat the live probes cannot solve: probing now returns OPEN (the problem isn't
reproducing). Guided by the Skill, the agent recognises the incident is historical and reaches
for flow_log_query - passing the reported start_time/end_time to scope exactly the window ->
PERSISTENT_REJECT with first_reject/last_reject bracketing the incident and top_peers = the
client's IP => it was a security-group block on tcp/5432 during that window, since restored.
Verified end-to-end: live tcp_reachability:5432 = OPEN while flow_log_query returns the past
REJECTs with correct timestamps.
Security & disclaimer
- Demo posture: the target host has a public IP and
nginxon:80for a realistic reachability story, and the MCP endpoint is a public API Gateway URL guarded by an API key. This is fine for a short-lived demo but is not a hardened production posture — do not leave it running unattended, and treat the API key as a secret. - Use at your own risk. You are responsible for any AWS resources you deploy and the charges they incur. Review the code and the Cost section before deploying, and tear down when finished.
Установка Devops Agent Networking
У этого сервера нет опубликованного пакета — он собирается из исходников. Открой репозиторий и следуй инструкции в README.
▸ github.com/InitialXW/devops-agent-networkingFAQ
Devops Agent Networking MCP бесплатный?
Да, Devops Agent Networking MCP бесплатный — установка в пару кликов через Unyly без оплаты.
Нужен ли API-ключ для Devops Agent Networking?
Нет, Devops Agent Networking работает без API-ключей и переменных окружения.
Devops Agent Networking — hosted или self-hosted?
Доступен hosted-вариант: Unyly запускает сервер в облаке, локальная установка не обязательна.
Как установить Devops Agent Networking в Claude Desktop, Claude Code или Cursor?
Открой Devops Agent Networking на unyly.org, выбери вкладку своего клиента (Claude Desktop, Claude Code, Cursor) и нажми Install — конфиг сгенерируется автоматически, без правки JSON.
Похожие MCP
GitHub
PRs, issues, code search, CI status
 автор: GitHub
Filesystem
Secure file operations with configurable access controls.
Memory
Knowledge graph-based persistent memory system.
Template MCP Server
A CLI tool to create a new Model Context Protocol server project with TypeScript support, dual transport options, and an extensible structure
 автор: mcpdotdirect
Compare Devops Agent Networking with
Не уверен что выбрать?
Найди свой стек за 60 секунд
Автор?
Embed-бейдж для README
Похожее
Все в категории development