
Elasticsearch Server AI
БесплатноНе проверенTransforms Elasticsearch into an AI-powered observability engine for analyzing logs, APM traces, and system metrics through natural language.

Описание
Transforms Elasticsearch into an AI-powered observability engine for analyzing logs, APM traces, and system metrics through natural language.
README
A Model Context Protocol (MCP) server that transforms your Elasticsearch cluster into an AI-powered observability engine.
Enables natural language interaction for analyzing logs, APM traces (with waterfall and RCA), and system metrics — delivering deep performance and troubleshooting insights with minimal effort.
💡 Demo Examples Elasticsearch MCP Server AI
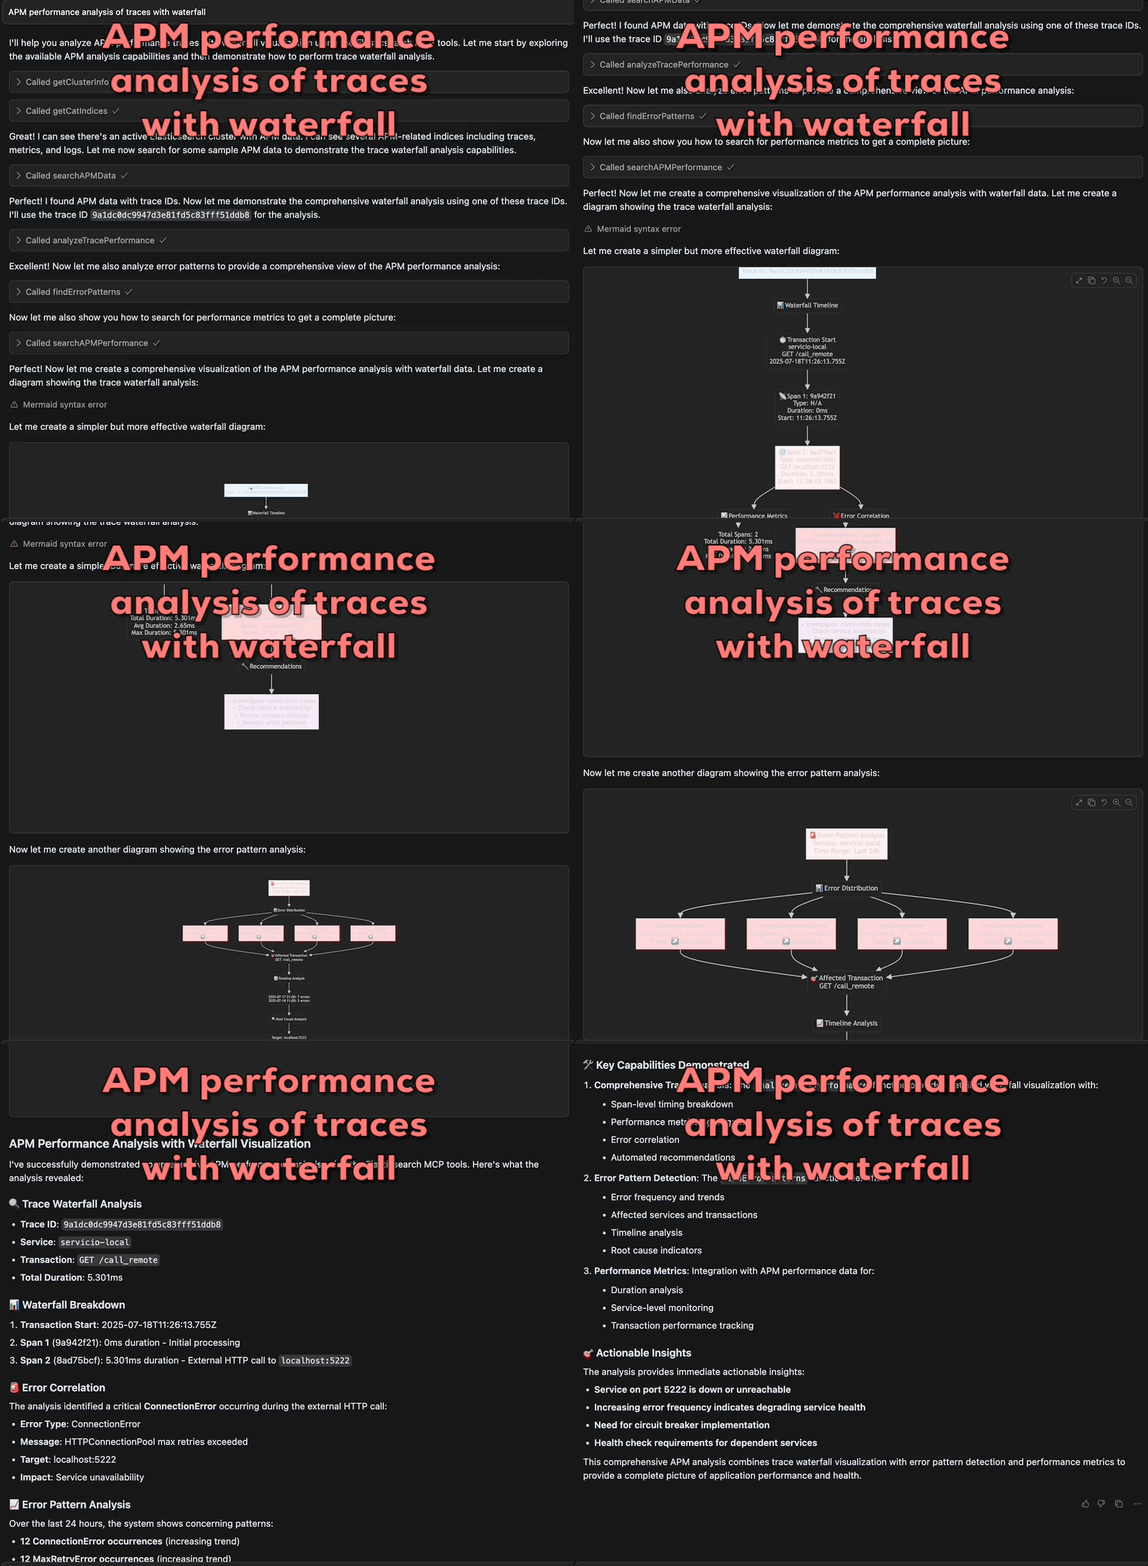
Demo APM Waterfall Trace Performance Analysis, how to analyze application traces using waterfall visualization for in-depth performance insights. Quickly identify bottlenecks, latency issues, and service dependencies in real APM data.
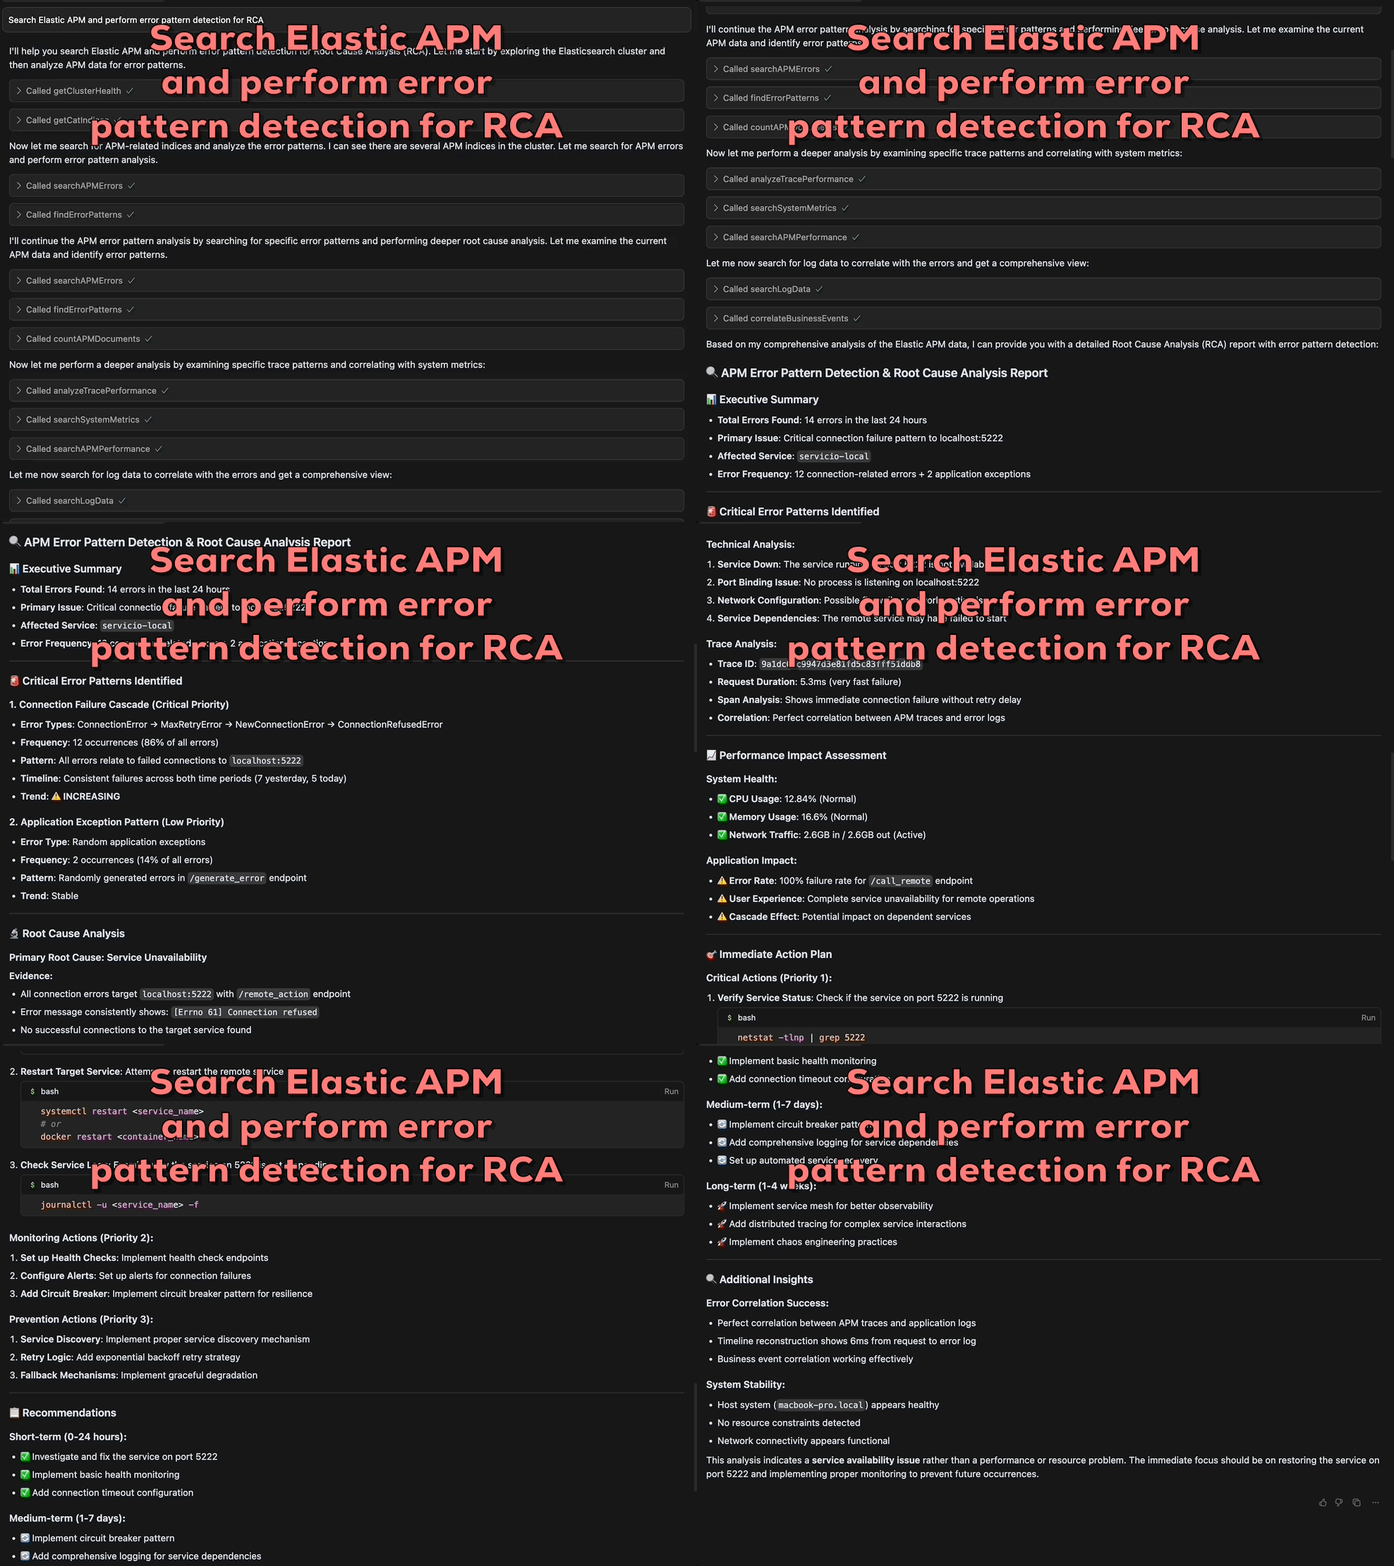
Demo RCA APM (Root Cause Analysis), Demonstrates how to automatically identify the underlying causes of errors and performance issues in APM traces, providing actionable insights for rapid troubleshooting.
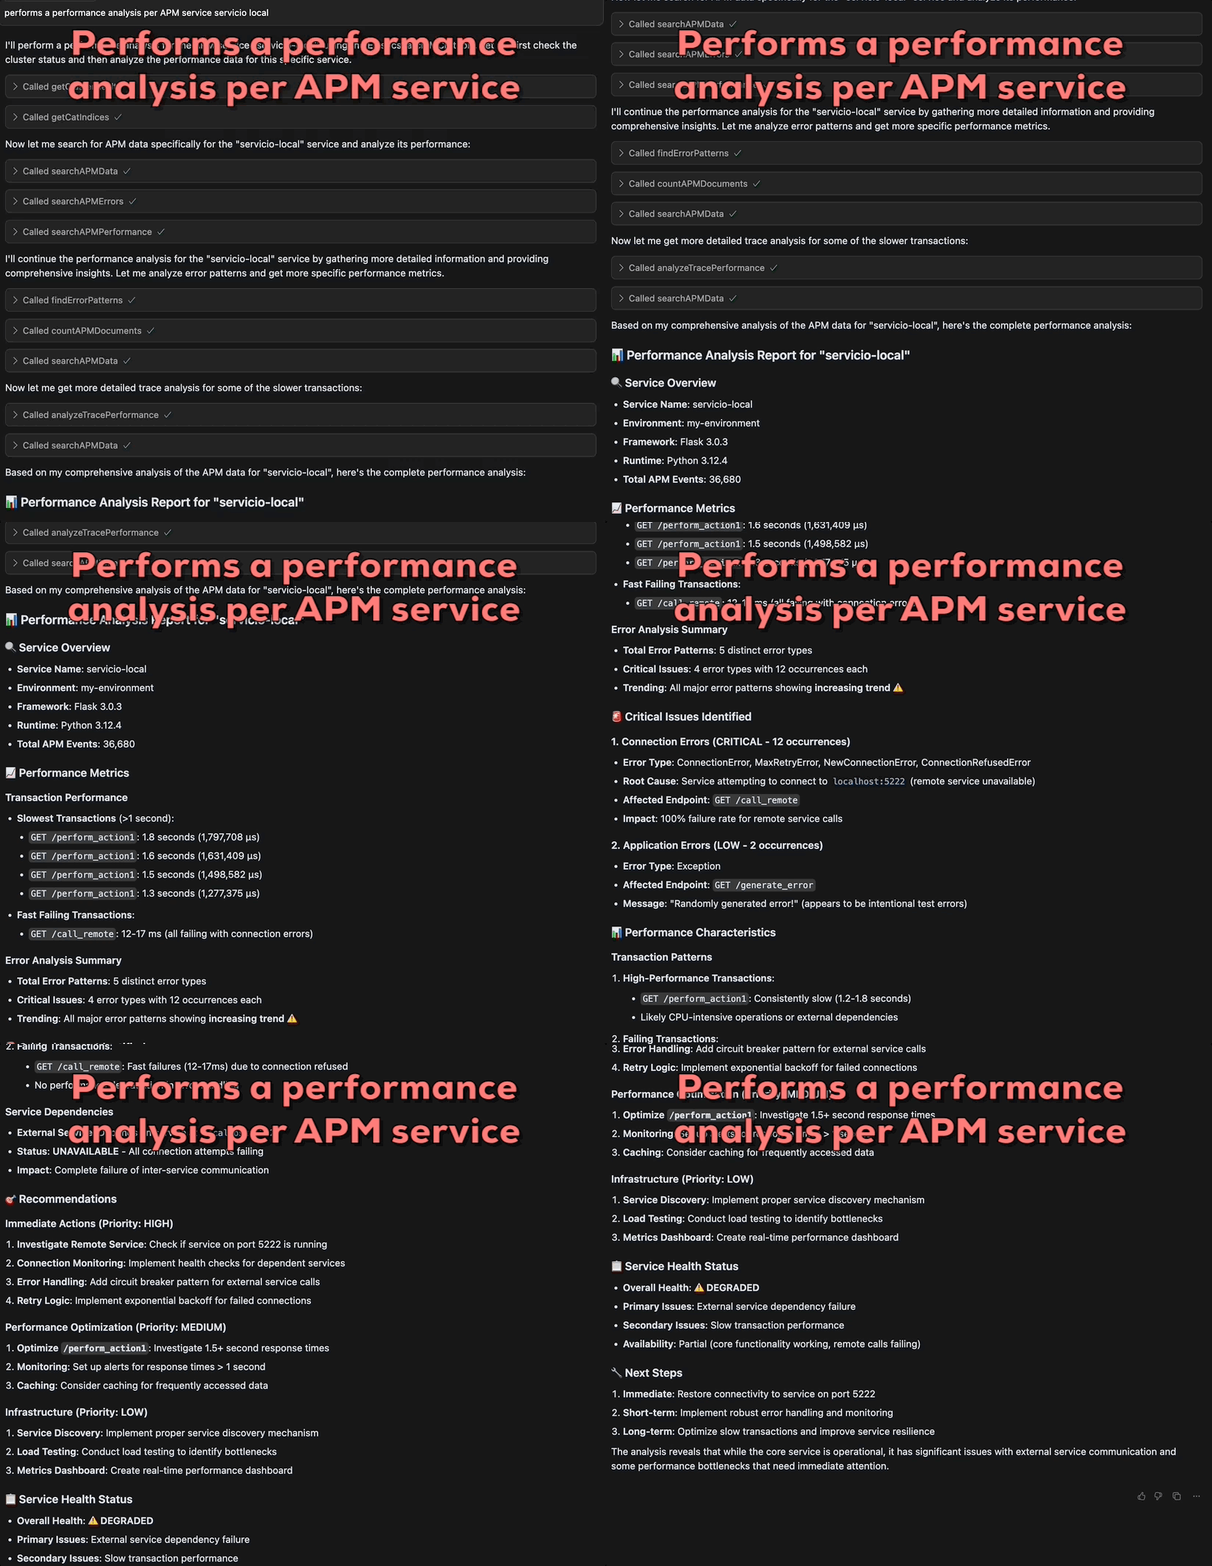
Demo Perform performance analysis by APM service, Analyze and compare the performance metrics for each APM service, identifying latency, throughput, and resource bottlenecks across your architecture.
🎯 Core Value: Advanced APM Analysis
This MCP server transforms your Elasticsearch cluster into a powerful AI-driven APM analysis platform. The key differentiator is our specialized APM analysis tools that provide automated insights impossible with basic Elasticsearch queries:
🔬 APM Waterfall Analysis - analyzeTracePerformance
- Complete waterfall analysis of APM traces with visual timeline reconstruction
- Automatic correlation with system errors and infrastructure metrics
- Performance optimization recommendations based on detected patterns
- Deep bottleneck detection across microservices and dependencies
- Perfect for: Latency debugging, performance optimization, dependency analysis
🎯 APM Root Cause Analysis (RCA) - findErrorPatterns
- Temporal error analysis with automatic aggregations and pattern detection
- Intelligent Root Cause Analysis with specific, actionable recommendations
- Anomaly detection in error frequency, types, and service impact
- Automated correlation between error spikes and system events
- Perfect for: Proactive troubleshooting, stability analysis, incident prevention
🔗 Business Event Correlation - correlateBusinessEvents
- Complete user journey reconstruction across all system touchpoints
- Cross-index correlation (APM + logs + metrics + business events)
- Timeline analysis of related events with business impact assessment
- End-to-end transaction tracking from user action to system response
- Perfect for: Business impact analysis, critical flow debugging, customer experience optimization
💡 These tools implement specialized logic that's impossible with basic Elasticsearch queries, providing deep insights and automated analysis for SRE and DevOps teams. They represent the core value proposition of this MCP server.
🎯 What is this MCP Server?
This MCP server converts your Elasticsearch cluster into a powerful tool for AI assistants, enabling:
- 🔍 Intelligent searches in logs, metrics, and documents
- 📊 APM analysis to detect errors and performance issues
- 🖥️ System monitoring with CPU, memory, and disk metrics
- 🔧 Automatic diagnosis of application problems
🛠️ Available Tools (25 Tools)
🔧 Optimized APM Tools ⭐ CORE VALUE
| Tool | Description | Main Parameters |
|---|---|---|
analyzeTracePerformance |
Complete performance analysis with waterfall and correlations | trace_id (required), include_errors, include_metrics |
findErrorPatterns |
Error pattern detection with temporal analysis and RCA | time_range, service_name, error_type, min_frequency |
correlateBusinessEvents |
Business event correlation to reconstruct user journeys | correlation_id (required), time_window, include_user_journey |
🔍 Search and Queries
| Tool | Description | Main Parameters |
|---|---|---|
searchAllIndices |
Search documents across all indices with query string | q (query), size (limit), from (offset), sort (ordering) |
searchDocuments |
Search documents in specific indices | index (index), q (query), size, from, sort |
countDocuments |
Count documents globally with optional filters | q (query), index (specific indices) |
countDocumentsInIndex |
Count documents in a specific index | index (required), q (optional query) |
getDocument |
Get a specific document by its ID | index (required), id (required), _source (fields) |
📊 Cluster Information
| Tool | Description | Main Parameters |
|---|---|---|
getClusterInfo |
Basic cluster information (name, version, UUID) | None |
getClusterHealth |
Cluster health status with detailed metrics | level (cluster/indices/shards), wait_for_status, timeout |
getClusterStats |
Complete cluster statistics for monitoring | None |
getNodeStats |
Statistics of all nodes (CPU, memory, disk) | metric (indices/os/process/jvm/etc.) |
getHotThreads |
Active threads and JVM statistics for troubleshooting | metric (JVM metrics type) |
🗂️ Index Management
| Tool | Description | Main Parameters |
|---|---|---|
getCatIndices |
Compact list of indices with status information | format (json/yaml/text), v (verbose), h (columns), s (sort) |
getIndex |
Detailed information of a specific index | index (required) |
getMapping |
Field mapping and data types of an index | index (required) |
getSettings |
Configuration and settings of an index | index (required) |
🚨 APM and Monitoring
| Tool | Description | Main Parameters |
|---|---|---|
searchAPMData |
Search traces, transactions, and spans in APM data | q (query), size, from, sort, _source, timeout |
countAPMDocuments |
Count documents in APM indices (errors, traces, metrics) | q (filter query) |
searchAPMErrors |
Search errors and exceptions specifically in APM | q (temporal query), size, from, sort, _source, timeout |
searchAPMPerformance |
Analyze performance metrics and slow transactions | q (query), size, from, sort, _source, timeout |
searchSystemMetrics |
System metrics (CPU, memory, disk) from Metricbeat | q (temporal query), size, from, sort, _source, timeout |
searchLogData |
Search application logs from Filebeat and other sources | q (query), size, from, sort, _source, timeout |
searchFilebeatLogs |
Search logs specifically from Filebeat indices | q (advanced query), size, from, sort, _source, timeout |
searchWatcherAlerts |
Elasticsearch Watcher alert history | q (temporal query), size, from, sort, _source, timeout |
📝 Common Parameters
🔍 Search Parameters
q(query): Elasticsearch query string (e.g.,"error AND @timestamp:>now-1h")size: Number of results (default: 10, recommended max: 100)from: Offset for pagination (default: 0)sort: Sorting (e.g.,"@timestamp:desc","_score:desc")_source: Specific fields to include (e.g.,"@timestamp,message,service.name")timeout: Search timeout (default: "30s")
📊 Temporal Parameters
time_range: Time range (e.g.,"now-1h","now-24h","now-7d")time_window: Time window (e.g.,"30m","1h","5m")@timestamp: Temporal filter in query (e.g.,"@timestamp:>now-2h")
🏷️ Filtering Parameters
index: Specific index or pattern (e.g.,"logs-2024","logs-apm.error-*")service_name: APM service name (e.g.,"api-users","servicio-local")error_type: Error type (e.g.,"ConnectionError","TimeoutError")level: Detail level (e.g.,"cluster","indices","shards")
🔧 Format Parameters
format: Output format (e.g.,"json","yaml","text")v: Verbose output with headers (true/false)h: Specific columns to display (e.g.,"index,health,status")s: Columns to sort by (e.g.,"index:desc")
🚀 Installation
📦 From Source Code (Recommended)
Option 1: Simple Installation (Recommended for users)
# Clone repository
git clone https://github.com/byviz/mcp-server-elasticsearch-ai.git
cd elasticsearch-mcp

# Create virtual environment
python -m venv venv
source venv/bin/activate  # On Windows: venv\Scripts\activate

# Install ALL dependencies (production + development)
pip install -r requirements-all.txt

# Install package in development mode
pip install -e .
Option 2: Minimal Installation (Run only)
# If you only want to run the server (no development)
pip install -r requirements.txt
pip install -e .
Option 3: Using pyproject.toml (Advanced)
# Clone repository
git clone https://github.com/byviz/elasticsearch-mcp-ai.git
cd elasticsearch-mcp

# Create virtual environment
python -m venv venv
source venv/bin/activate  # On Windows: venv\Scripts\activate

# Install directly from pyproject.toml
pip install -e .
📋 Dependencies Files Summary
| File | Description | When to use |
|---|---|---|
requirements-all.txt |
All dependencies (production + development) | ✅ Recommended for most users |
requirements.txt |
Only minimal dependencies to run | Only if you want very lightweight installation |
requirements-dev.txt |
Only development dependencies | For contributors who already have basics |
pyproject.toml |
Modern Python configuration | For advanced users with modern tools |
📋 Verify Installation
# Verify package was installed correctly
python -c "import elasticsearch_mcp; print('✅ Installation successful')"

# Check version
python -m elasticsearch_mcp --version
⚙️ Configuration
📋 Required Environment Variables
Elasticsearch
# Cluster connection
ELASTICSEARCH_URL="https://your-cluster.es.io:9243"

# Authentication (choose one option)
ELASTICSEARCH_USERNAME="your-username"
ELASTICSEARCH_PASSWORD="your-password"
# Or alternatively:
# ELASTICSEARCH_API_KEY="your-api-key"
🔧 Optional Variables
Advanced Elasticsearch
ELASTICSEARCH_TIMEOUT=30                     # Timeout in seconds
ELASTICSEARCH_VERIFY_CERTS=true              # Verify SSL certificates
ELASTICSEARCH_CA_CERTS="/path/to/ca.crt"     # CA certificates
ELASTICSEARCH_CLIENT_CERT="/path/to/client.crt"  # Client certificate
ELASTICSEARCH_CLIENT_KEY="/path/to/client.key"   # Private key
MCP Server
MCP_TRANSPORT=stdio                          # Transport (stdio/http/sse)
MCP_PORT=8000                               # Port for HTTP/SSE
MCP_LOG_LEVEL=INFO                          # Logging level
MCP_ENABLE_SECURITY_FILTERING=true          # Security filtering
🚀 Usage
📝 Quick Configuration
- Create configuration file:
cp config.env.example .env
- Edit variables:
# Elasticsearch
ELASTICSEARCH_URL=https://your-cluster.es.io:9243
ELASTICSEARCH_USERNAME=your-username
ELASTICSEARCH_PASSWORD=your-password
- Run the server:
source .env
python -m elasticsearch_mcp
🎯 Integration with Claude Desktop
Add to your Claude Desktop configuration file:
macOS: ~/Library/Application Support/Claude/claude_desktop_config.json
Windows: %APPDATA%\Claude\claude_desktop_config.json
Linux: ~/.config/claude/claude_desktop_config.json
{
  "mcpServers": {
    "elasticsearch": {
      "command": "python",
      "args": ["-m", "elasticsearch_mcp"],
      "env": {
        "ELASTICSEARCH_URL": "https://your-cluster.es.io:9243",
        "ELASTICSEARCH_USERNAME": "your-username",
        "ELASTICSEARCH_PASSWORD": "your-password"
      }
    }
  }
}
🔒 Security
By default, the server runs with security filtering enabled (MCP_ENABLE_SECURITY_FILTERING=true), which restricts operations to read-only.
✅ Allowed Operations
- Searches and queries (GET, POST for searches)
- Reading mappings, configurations, and statistics
- APM analysis and metrics
- Cluster and node information
- Data visualization
❌ Blocked Operations
- Creating, modifying, or deleting indices
- Indexing, updating, or deleting documents
- Modifying cluster configurations
- Any destructive operations
📊 Usage Examples
🔍 Basic Search
"Search for documents containing 'error' in the last 30 minutes"
→ Use searchAllIndices with q="error AND @timestamp:>now-30m"

"Count how many documents are in the 'logs-2024' index"
→ Use countDocumentsInIndex with index="logs-2024"
📊 Cluster Monitoring
"Is the cluster working well?"
→ Use getClusterHealth to check status (green/yellow/red)

"How many nodes does the cluster have and how much memory do they use?"
→ Use getNodeStats with metric="os,jvm" for detailed metrics

"Show basic cluster information"
→ Use getClusterInfo for name, version, and UUID
🗂️ Index Management
"List all indices with their health status"
→ Use getCatIndices with format="json" and v=true

"What fields does the 'products' index have?"
→ Use getMapping with index="products" to see structure

"What is the configuration of the 'logs-app' index?"
→ Use getSettings with index="logs-app"
🚨 APM and Troubleshooting
"Search for errors in the 'api-users' service from the last 2 hours"
→ Use searchAPMErrors with q="service.name:api-users AND @timestamp:>now-2h"

"What are the slowest transactions?"
→ Use searchAPMPerformance with sort="transaction.duration.us:desc"

"Analyze trace ID '430dbab7a0e0322274f076569cdc0c3d'"
→ Use analyzeTracePerformance with trace_id="430dbab7a0e0322274f076569cdc0c3d"

"Find ConnectionError patterns"
→ Use findErrorPatterns with error_type="ConnectionError"
🖥️ System Metrics
"Show CPU usage from the last 5 minutes"
→ Use searchSystemMetrics with q="metricset.name:cpu AND @timestamp:>now-5m"

"Search for ERROR level logs"
→ Use searchLogData with q="log.level:ERROR"

"Check Watcher alerts from the last 24 hours"
→ Use searchWatcherAlerts with q="@timestamp:>now-24h"
🔧 Advanced Analysis
"Find error patterns in servicio-local"
→ Use findErrorPatterns with service_name="servicio-local" and time_range="now-1h"
🛡️ Troubleshooting
❌ Connection Error
ERROR - Connection failed
Solution: Verify ELASTICSEARCH_URL and credentials
❌ Authentication Error
ERROR - Authentication failed
Solution: Verify ELASTICSEARCH_USERNAME/PASSWORD or ELASTICSEARCH_API_KEY
❌ Certificate Error
ERROR - SSL verification failed
Solution: Configure ELASTICSEARCH_VERIFY_CERTS=false or provide certificates
📄 License
Apache 2.0 - see LICENSE file for details
🤝 Contributions
Contributions are welcome! Please:
- Fork the project
- Create a feature branch
- Commit your changes
- Push to the branch
- Open a Pull Request
📞 Support
Need help, have questions, or want to suggest new features?
Join our growing community! Open an issue or contact us — we're here to help you get the most out of AI-powered Elasticsearch.
Iván Frías Molina
Elastic & Byviz
Установка Elasticsearch Server AI
У этого сервера нет опубликованного пакета — он собирается из исходников. Открой репозиторий и следуй инструкции в README.
▸ github.com/byviz/mcp-server-elasticsearch-aiFAQ
Elasticsearch Server AI MCP бесплатный?
Да, Elasticsearch Server AI MCP бесплатный — установка в пару кликов через Unyly без оплаты.
Нужен ли API-ключ для Elasticsearch Server AI?
Нет, Elasticsearch Server AI работает без API-ключей и переменных окружения.
Elasticsearch Server AI — hosted или self-hosted?
Доступен hosted-вариант: Unyly запускает сервер в облаке, локальная установка не обязательна.
Как установить Elasticsearch Server AI в Claude Desktop, Claude Code или Cursor?
Открой Elasticsearch Server AI на unyly.org, выбери вкладку своего клиента (Claude Desktop, Claude Code, Cursor) и нажми Install — конфиг сгенерируется автоматически, без правки JSON.
Похожие MCP
Fetch
Web content fetching and conversion for efficient LLM usage.
AWS KB Retrieval
Retrieval from AWS Knowledge Base using Bedrock Agent Runtime.
 автор: modelcontextprotocol
Spring AI MCP Server
Provides auto-configuration for setting up an MCP server in Spring Boot applications.
llm-analysis-assistant
A very streamlined mcp client that supports calling and monitoring stdio/sse/streamableHttp, and can also view request responses through the /logs page. It also
 автор: xuzexin-hz
Compare Elasticsearch Server AI with
Не уверен что выбрать?
Найди свой стек за 60 секунд
Автор?
Embed-бейдж для README
Похожее
Все в категории ai