loading…
/ru
Весь каталог
HanSur94/matlab-mcp-server-python
БесплатноConnect AI agents to MATLAB — execute code, run async jobs with progress reporting, get interactive Plotly plots, expose custom .m functions as tools, and monit
Описание
Connect AI agents to MATLAB — execute code, run async jobs with progress reporting, get interactive Plotly plots, expose custom .m functions as tools, and monitor via live dashboard.
README
MATLAB MCP Server
Give any AI agent the power of MATLAB — via the Model Context Protocol
Quick Start • Examples • Tools Reference • Configuration • Wiki
![]()


![]()

A Python MCP server that connects any AI agent (Claude, Cursor, Copilot, custom agents) to a shared MATLAB installation. Execute code, discover toolboxes, check code quality, get interactive Plotly plots, and run long simulations — all through MCP.
Why?
- Your AI agent can now write and run MATLAB code directly
- Long-running jobs (hours!) run async — the agent keeps working while MATLAB computes
- Multiple users share one MATLAB server via an elastic engine pool
- Interactive plots come back as Plotly JSON — renderable in any web UI
- Custom MATLAB libraries become first-class AI tools with zero code changes
Features
| Feature | Description |
|---|---|
| Execute MATLAB code | Sync for fast commands, auto-async for long jobs |
| Elastic engine pool | Scales 2-10+ engines based on demand |
| Toolbox discovery | Browse installed toolboxes, functions, help text |
| Code checker | Run checkcode/mlint before execution |
| Interactive plots | Figures auto-converted to Plotly JSON |
| Multi-user (SSE) | Session isolation with per-user workspaces |
| Custom tools | Expose your .m functions as MCP tools via YAML |
| Progress reporting | Long jobs report percentage back to the agent |
| Cross-platform | Windows + macOS, MATLAB R2022b+ |
| One-click Windows install | Offline install.bat — no admin rights needed |
MATLAB Plot Conversion to Interactive Plotly
Every MATLAB figure is automatically converted into an interactive Plotly chart — no extra code needed. When your MATLAB code creates a plot, the server:
- Extracts figure properties via
mcp_extract_props.m— axes, line data, labels, colors, markers, legends, subplots - Maps MATLAB styles to Plotly — line styles (
--→dash), markers (o→circle), legend positions, axis scales, colormaps - Returns interactive JSON — renderable in any web UI with
Plotly.newPlot() - Generates a static PNG + thumbnail as fallback for non-interactive clients
Supported plot types: line, scatter, bar, area, subplots (subplot/tiledlayout), multiple axes, log/linear scales
Style fidelity: Line styles, marker shapes, colors (RGB), line widths, font sizes, axis labels, titles, legends, grid lines, axis limits, and background colors are all preserved.
% This MATLAB code...
x = linspace(0, 2*pi, 200);
plot(x, sin(x), 'r-', 'LineWidth', 2); hold on;
plot(x, cos(x), 'b--', 'LineWidth', 2);
plot(x, sin(x) .* cos(x), 'g-.', 'LineWidth', 2);
legend('sin(x)', 'cos(x)', 'sin(x)*cos(x)');
xlabel('x'); ylabel('y');
title('Trigonometric Functions');
...automatically becomes this interactive Plotly chart:
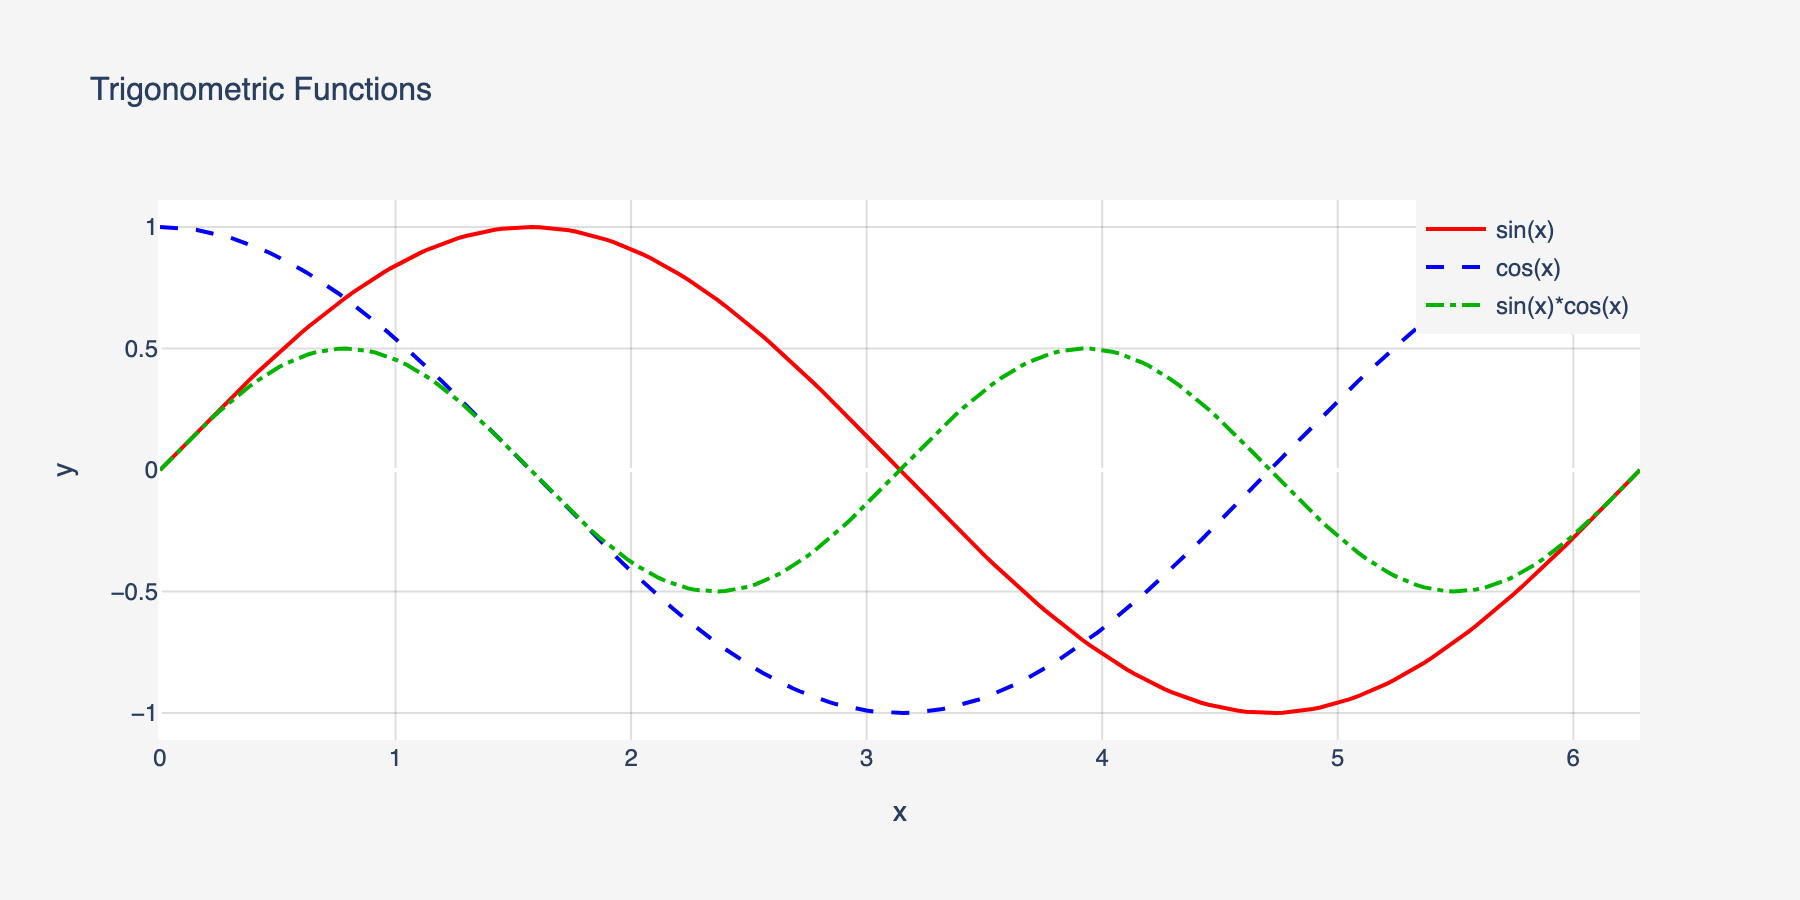
Line styles, colors, markers, legends, and axis labels are all preserved in the conversion.
Quick Start
Prerequisites
- Python 3.10+
- MATLAB R2022b+ with the MATLAB Engine API for Python installed
# Install MATLAB Engine API (from your MATLAB installation)
cd /Applications/MATLAB_R2024a.app/extern/engines/python  # macOS
# cd "C:\Program Files\MATLAB\R2024a\extern\engines\python"  # Windows
pip install .
Install the server
Windows (one-click, no admin needed):
git clone https://github.com/HanSur94/matlab-mcp-server-python.git
cd matlab-mcp-server-python
install.bat
The installer auto-detects MATLAB, creates a virtual environment, and installs everything from bundled wheels — fully offline, no internet required. Works on Windows 10/11 with Python 3.10, 3.11, or 3.12.
macOS / Linux:
# Option 1: Install from PyPI
pip install matlab-mcp-python

# Option 2: Install from source
git clone https://github.com/HanSur94/matlab-mcp-server-python.git
cd matlab-mcp-server-python
pip install -e ".[dev]"
Run it
# Single user (stdio) — simplest setup
matlab-mcp

# Multi-user (SSE) — shared server
matlab-mcp --transport sse
Connect to Claude Desktop
Add to your Claude Desktop config (~/Library/Application Support/Claude/claude_desktop_config.json on macOS):
{
  "mcpServers": {
    "matlab": {
      "command": "matlab-mcp"
    }
  }
}
Connect to Claude Code
claude mcp add matlab -- matlab-mcp
Connect to Cursor
Add to .cursor/mcp.json in your project:
{
  "mcpServers": {
    "matlab": {
      "command": "matlab-mcp"
    }
  }
}
Run with Docker
# Build the image
docker build -t matlab-mcp .

# Run with your MATLAB mounted
docker run -p 8765:8765 -p 8766:8766 \
  -v /path/to/MATLAB:/opt/matlab:ro \
  -e MATLAB_MCP_POOL_MATLAB_ROOT=/opt/matlab \
  matlab-mcp

# Or use docker-compose (edit docker-compose.yml to set your MATLAB path)
docker compose up
Note: The Docker image does not include MATLAB. You must mount your own MATLAB installation.
Upgrading? If you previously installed as
matlab-mcp-server, uninstall first:pip uninstall matlab-mcp-server && pip install matlab-mcp-python
Examples
Basic: Run MATLAB Code
Ask your AI agent:
"Calculate the eigenvalues of a 3x3 magic square in MATLAB"
The agent calls execute_code:
A = magic(3);
eigenvalues = eig(A);
disp(eigenvalues)
Result returned inline:
15.0000
 4.8990
-4.8990
Signal Processing
"Generate a 1kHz sine wave, add noise, then filter it with a low-pass Butterworth filter and plot both"
fs = 8000;
t = 0:1/fs:0.1;
clean = sin(2*pi*1000*t);
noisy = clean + 0.5*randn(size(t));

[b, a] = butter(6, 1500/(fs/2));
filtered = filter(b, a, noisy);

subplot(2,1,1); plot(t, noisy); title('Noisy Signal');
subplot(2,1,2); plot(t, filtered); title('Filtered Signal');
Returns: Interactive Plotly chart + static PNG + thumbnail.
Long-Running Simulation (Async)
"Run a Monte Carlo simulation with 1 million trials"
n = 1e6;
results = zeros(n, 1);
for i = 1:n
    results(i) = simulate_trial();  % your custom function
    if mod(i, 1e5) == 0
        mcp_progress(__mcp_job_id__, i/n*100, sprintf('Trial %d/%d', i, n));
    end
end
disp(mean(results));
The agent gets a job ID immediately, polls progress ("Trial 500000/1000000 — 50%"), and retrieves results when done.
Custom Tools
Expose your proprietary MATLAB functions as first-class AI tools. Create custom_tools.yaml:
tools:
  - name: analyze_signal
    matlab_function: mylib.analyze_signal
    description: "Analyze a signal and return frequency components, SNR, and peak detection"
    parameters:
      - name: signal_path
        type: string
        required: true
      - name: sample_rate
        type: float
        required: true
      - name: window_size
        type: int
        default: 1024
    returns: "Struct with fields: frequencies, magnitudes, snr, peaks"

  - name: train_model
    matlab_function: ml.train_classifier
    description: "Train a classification model on the given dataset"
    parameters:
      - name: dataset_path
        type: string
        required: true
      - name: model_type
        type: string
        default: "svm"
    returns: "Trained model object saved to workspace"
Now the agent can call analyze_signal or train_model directly — with full parameter validation and help text.
MCP Tools Reference
Code Execution
| Tool | Parameters | Description |
|---|---|---|
execute_code |
code: str |
Run MATLAB code. Returns inline if fast (<30s), or a job ID if promoted to async |
check_code |
code: str |
Run checkcode/mlint. Returns structured warnings/errors |
get_workspace |
— | Show variables in the current MATLAB workspace |
Async Job Management
| Tool | Parameters | Description |
|---|---|---|
get_job_status |
job_id: str |
Status + progress percentage for running jobs |
get_job_result |
job_id: str |
Full result of a completed job |
cancel_job |
job_id: str |
Cancel a pending or running job |
list_jobs |
— | List all jobs in this session |
Discovery
| Tool | Parameters | Description |
|---|---|---|
list_toolboxes |
— | List installed MATLAB toolboxes |
list_functions |
toolbox_name: str |
List functions in a toolbox |
get_help |
function_name: str |
Get MATLAB help text for any function |
File Management
| Tool | Parameters | Description |
|---|---|---|
upload_data |
filename: str, content_base64: str |
Upload data files to the session |
delete_file |
filename: str |
Delete a session file |
list_files |
— | List files in the session directory |
File Reading
| Tool | Parameters | Description |
|---|---|---|
read_script |
filename: str |
Read a MATLAB .m script file as text |
read_data |
filename: str, format: str |
Read data files (.mat, .csv, .json, .txt, .xlsx). format: summary or raw |
read_image |
filename: str |
Read image files (.png, .jpg, .gif) — renders inline in agent UIs |
Admin
| Tool | Parameters | Description |
|---|---|---|
get_pool_status |
— | Engine pool stats (available/busy/max) |
Monitoring
| Tool | Parameters | Description |
|---|---|---|
get_server_metrics |
— | Comprehensive server metrics (pool, jobs, sessions, system) |
get_server_health |
— | Health status with issue detection (healthy/degraded/unhealthy) |
get_error_log |
limit: int |
Recent errors and notable events |
Configuration
All settings live in config.yaml with sensible defaults. Override any setting via environment variables:
# Override pool size
export MATLAB_MCP_POOL_MIN_ENGINES=4
export MATLAB_MCP_POOL_MAX_ENGINES=16

# Override sync timeout (promote to async after 60s instead of 30s)
export MATLAB_MCP_EXECUTION_SYNC_TIMEOUT=60

# Override transport
export MATLAB_MCP_SERVER_TRANSPORT=sse
Key Configuration Sections
Server — transport, host, port, logging
server:
  name: "matlab-mcp-server"
  transport: "stdio"        # stdio | sse
  host: "0.0.0.0"           # SSE only
  port: 8765                # SSE only
  log_level: "info"         # debug | info | warning | error
  log_file: "./logs/server.log"
  result_dir: "./results"
  drain_timeout_seconds: 300
Pool — engine count, scaling, health checks
pool:
  min_engines: 2            # always warm
  max_engines: 10           # hard ceiling
  scale_down_idle_timeout: 900   # 15 min
  engine_start_timeout: 120
  health_check_interval: 60
  proactive_warmup_threshold: 0.8
  queue_max_size: 50
  matlab_root: null         # auto-detect
Execution — timeouts, workspace isolation
execution:
  sync_timeout: 30          # seconds before async promotion
  max_execution_time: 86400 # 24h hard limit
  workspace_isolation: true
  engine_affinity: false    # pin session to engine
  temp_dir: "./temp"
  temp_cleanup_on_disconnect: true
Security — function blocklist, upload limits
security:
  blocked_functions_enabled: true
  blocked_functions:
    - "system"
    - "unix"
    - "dos"
    - "!"
    - "eval"
    - "feval"
    - "evalc"
    - "evalin"
    - "assignin"
    - "perl"
    - "python"
  max_upload_size_mb: 100
  require_proxy_auth: false
Toolboxes — whitelist/blacklist exposure
toolboxes:
  mode: "whitelist"         # whitelist | blacklist | all
  list:
    - "Signal Processing Toolbox"
    - "Optimization Toolbox"
    - "Statistics and Machine Learning Toolbox"
    - "Image Processing Toolbox"
Output — Plotly, images, thumbnails
output:
  plotly_conversion: true
  static_image_format: "png"
  static_image_dpi: 150
  thumbnail_enabled: true
  thumbnail_max_width: 400
  large_result_threshold: 10000
  max_inline_text_length: 50000
Monitoring
Built-in observability with a web dashboard, JSON health/metrics endpoints, and MCP tools for AI agent self-monitoring.
Dashboard
Access at http://localhost:8766/dashboard (stdio) or http://localhost:8765/dashboard (SSE).
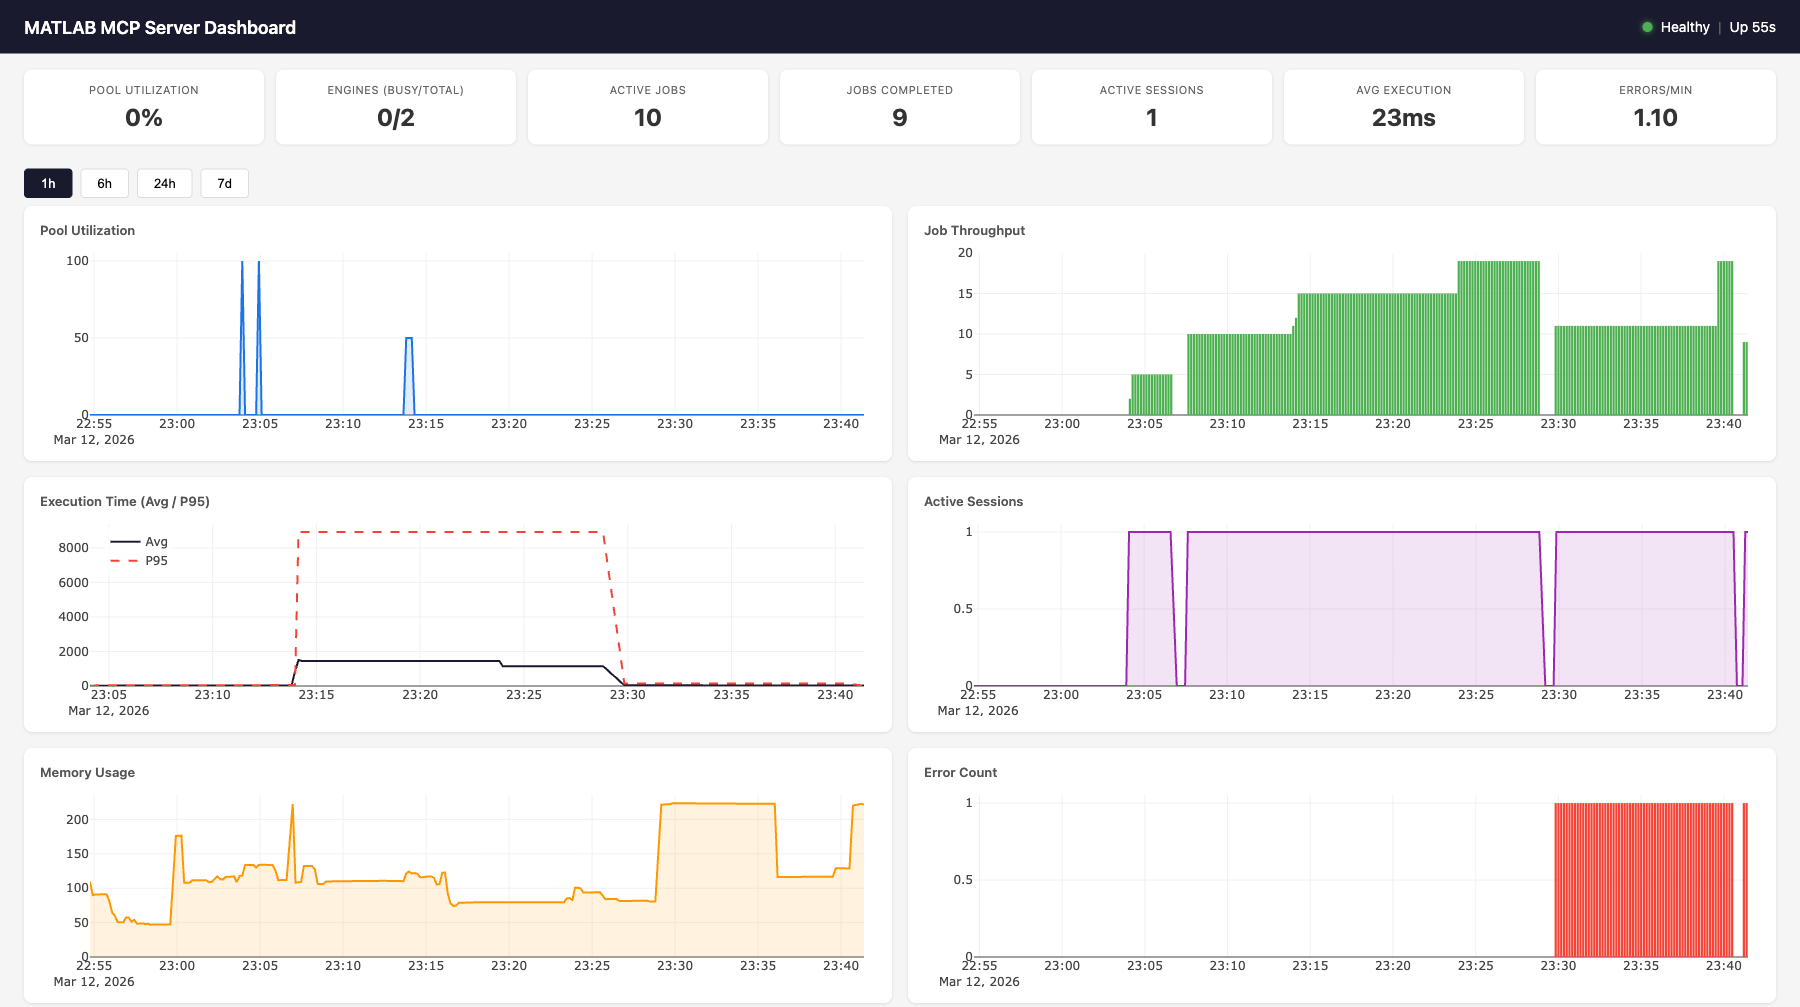
Features:
- 7 live gauges: pool utilization, engines (busy/total), active jobs, completed jobs, active sessions, avg execution time, errors/min
- 6 time-series charts (Plotly.js): pool utilization, job throughput, execution time (avg + p95), active sessions, memory usage, error count
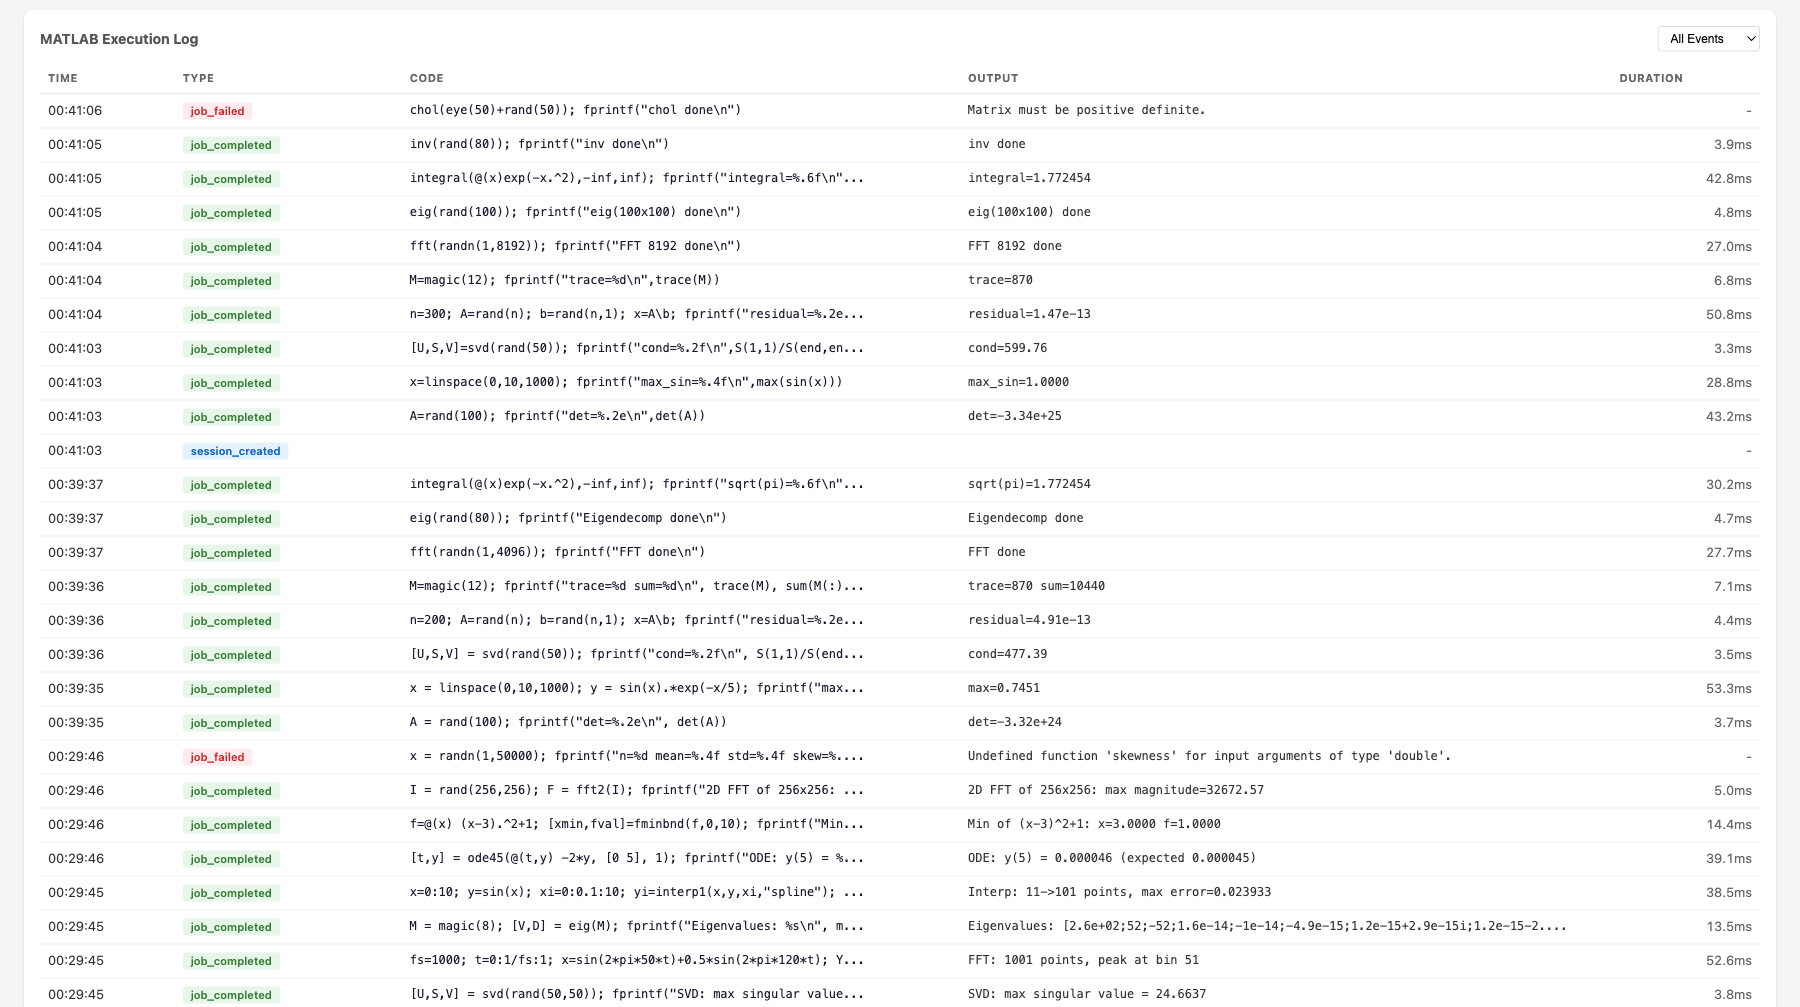
- MATLAB execution log: filterable table showing time, event type, MATLAB code, output, and duration for every job
- Time range selector: 1h, 6h, 24h, 7d views
- Auto-refreshes every 10 seconds
Health Endpoint
curl http://localhost:8766/health
{
  "status": "healthy",
  "uptime_seconds": 3600.1,
  "issues": [],
  "engines": {"total": 2, "available": 1, "busy": 1},
  "active_jobs": 1,
  "active_sessions": 3
}
Status codes: 200 for healthy/degraded, 503 for unhealthy.
Health evaluation rules:
| Status | Condition |
|---|---|
unhealthy |
No engines running (total == 0) |
unhealthy |
All engines busy at max capacity (available == 0 && total >= max_engines) |
degraded |
Pool utilization > 90% |
degraded |
Health check failures detected |
degraded |
Error rate > 5/min |
healthy |
None of the above |
Metrics Endpoint
curl http://localhost:8766/metrics
{
  "timestamp": "2026-03-12T23:01:56.799Z",
  "pool": {"total": 2, "available": 1, "busy": 1, "max": 10, "utilization_pct": 50.0},
  "jobs": {"active": 1, "completed_total": 47, "failed_total": 2, "cancelled_total": 0, "avg_execution_ms": 28.5},
  "sessions": {"total_created": 5, "active": 3},
  "errors": {"total": 2, "blocked_attempts": 0, "health_check_failures": 0},
  "system": {"uptime_seconds": 3600.1, "memory_mb": 108.8, "cpu_percent": 12.3}
}
Dashboard API
| Endpoint | Parameters | Description |
|---|---|---|
GET /health |
— | Health status + issues |
GET /metrics |
— | Live metrics snapshot (no DB hit) |
GET /dashboard |
— | Web dashboard HTML |
GET /dashboard/api/current |
— | Same as /metrics |
GET /dashboard/api/history |
metric, hours |
Time-series data from SQLite |
GET /dashboard/api/events |
limit, type |
Event log with MATLAB output |
Available history metrics: pool.utilization_pct, pool.total_engines, pool.busy_engines, jobs.completed_total, jobs.failed_total, jobs.avg_execution_ms, jobs.p95_execution_ms, sessions.active_count, system.memory_mb, system.cpu_percent, errors.total
Backend Architecture
                    ┌─────────────────────────────────────────────┐
                    │           MetricsCollector                   │
                    │                                             │
                    │  In-memory:                                 │
  record_event() ──│─▶ _counters (7 counters)                    │
  (sync, from any  │   _execution_times (ring buffer, maxlen=100)│
   component)      │                                             │
                    │  Background task (every 10s):               │
                    │   sample_once() ─▶ MetricsStore.insert()   │
                    │                                             │
                    │  Live snapshot (no DB):                     │
                    │   get_current_snapshot() ─▶ /metrics        │
                    └───────────┬─────────────────────────────────┘
                                │
                    ┌───────────▼─────────────────────────────────┐
                    │           MetricsStore (aiosqlite)           │
                    │                                             │
                    │  metrics table:                             │
                    │   id | timestamp | category | metric | value│
                    │   (4 indexes for fast queries)              │
                    │                                             │
                    │  events table:                              │
                    │   id | timestamp | event_type | details     │
                    │   (details = JSON with code, output, etc.)  │
                    │                                             │
                    │  Methods:                                   │
                    │   insert_metrics(), insert_event()          │
                    │   get_latest(), get_history(), get_events() │
                    │   get_aggregates(), prune()                 │
                    │                                             │
                    │  SQLite WAL mode, log-and-swallow errors    │
                    └───────────┬─────────────────────────────────┘
                                │
                    ┌───────────▼─────────────────────────────────┐
                    │     Starlette Dashboard App                  │
                    │                                             │
                    │  /health ─▶ evaluate_health(collector)      │
                    │  /metrics ─▶ collector.get_current_snapshot()│
                    │  /dashboard ─▶ cached index.html            │
                    │  /dashboard/api/* ─▶ store queries          │
                    │  /dashboard/static/* ─▶ JS, CSS, Plotly.js  │
                    └─────────────────────────────────────────────┘
Event Types
Events are recorded synchronously via collector.record_event() from any server component. Each event includes a JSON details field.
| Event Type | Source | Details Fields |
|---|---|---|
job_completed |
Executor | job_id, execution_ms, code, output |
job_failed |
Executor | job_id, code, error |
session_created |
SessionManager | session_id_short |
engine_scale_up |
PoolManager | engine_id, total_after |
engine_scale_down |
PoolManager | engine_id, total_after |
engine_replaced |
PoolManager | old_id, new_id |
health_check_fail |
PoolManager | engine_id, error |
blocked_function |
SecurityValidator | function, code_snippet |
In-Memory Counters
The collector maintains 7 counters updated on every event (no DB hit):
| Counter | Incremented By |
|---|---|
completed_total |
job_completed |
failed_total |
job_failed |
cancelled_total |
job_cancelled |
total_created_sessions |
session_created |
error_total |
Any error event (job_failed, blocked_function, engine_crash, health_check_fail) |
blocked_attempts |
blocked_function |
health_check_failures |
health_check_fail |
Execution Time Tracking
Job execution times are stored in a ring buffer (deque(maxlen=100)) for O(1) avg/p95 calculation without DB queries. The p95 is computed as sorted_times[int((len-1) * 0.95)].
Transport Integration
| Transport | Monitoring Port | How |
|---|---|---|
| SSE | Same as SSE port (8765) | Dashboard mounted as Starlette sub-app via mcp._additional_http_routes |
| stdio | Separate port (8766) | Uvicorn started as background asyncio.Task |
Data Retention
The cleanup loop runs every 60 seconds and calls store.prune(retention_days=7) to delete metrics and events older than the configured retention period. SQLite WAL mode ensures reads aren't blocked during writes.
Configuration
monitoring:
  enabled: true
  sample_interval: 10      # seconds between metric samples
  retention_days: 7         # days to keep historical data
  db_path: "./monitoring/metrics.db"
  dashboard_enabled: true
  http_port: 8766           # dashboard/health port (stdio only)
Environment overrides: MATLAB_MCP_MONITORING_ENABLED, MATLAB_MCP_MONITORING_SAMPLE_INTERVAL, etc.
Architecture
AI Agent (Claude, Cursor, etc.)
       │
       │ MCP Protocol (stdio or SSE)
       ▼
┌──────────────────────────────────────────────────────────┐
│   MCP Server (FastMCP 2.x)                                │
│   20 tools + custom tools                                 │
│   Session manager  │  Security validator  │  Formatter    │
└──────────┬───────────────────────────────┬───────────────┘
           │                               │
┌──────────▼──────────────────┐  ┌─────────▼──────────────┐
│   Job Executor               │  │  MetricsCollector       │
│   Sync/async execution       │  │  In-memory counters     │
│   Timeout auto-promotion     │  │  Ring buffer (p95)      │
│   stdout/stderr capture      │  │  Background sampling    │
│   Event recording ──────────────▶  Event recording       │
└──────────┬──────────────────┘  └─────────┬──────────────┘
           │                               │
┌──────────▼──────────────────┐  ┌─────────▼──────────────┐
│   MATLAB Pool Manager        │  │  MetricsStore (SQLite)  │
│   Elastic engine pool        │  │  Time-series metrics    │
│   Scale up/down on demand    │  │  Event log with output  │
│   Health checks & replace    │  │  Aggregates & history   │
└──────────┬──────────────────┘  └─────────┬──────────────┘
           │                               │
┌──────────▼──────────────────┐  ┌─────────▼──────────────┐
│   MATLAB Engines (R2022b+)    │  │  Dashboard (Starlette)  │
│   Engine 1 │ Engine 2 │ ... │  │  /health  /metrics      │
│   Workspace isolation        │  │  /dashboard (Plotly.js) │
└──────────────────────────────┘  └─────────────────────────┘
Request Flow
- AI agent sends
execute_codevia MCP protocol SecurityValidatorchecks code against function blocklistJobExecutorcreates a job, acquires an engine from the pool- Code runs in MATLAB with stdout/stderr captured via
StringIO - If completes within
sync_timeout(30s): result returned inline - If exceeds timeout: promoted to async, agent gets
job_idto poll MetricsCollector.record_event()logs code + output + duration- Engine released back to pool, workspace reset
Component Wiring
All components receive a collector reference at construction time. The collector is wired to live pool/tracker/sessions in the lifespan handler after startup. This allows synchronous record_event() calls from any component without async overhead.
# Construction (before event loop)
collector = MetricsCollector(config)
pool = EnginePoolManager(config, collector=collector)
executor = JobExecutor(pool, tracker, config, collector=collector)
sessions = SessionManager(config, collector=collector)
security = SecurityValidator(config.security, collector=collector)

# Lifespan (after event loop starts)
collector.pool = pool
collector.tracker = tracker
collector.sessions = sessions
collector.store = MetricsStore(config.monitoring.db_path)
Development
# Install dev dependencies
pip install -e ".[dev]"

# Run tests (no MATLAB needed — uses mock engine)
pytest tests/ -v

# Run with coverage
pytest tests/ --cov=matlab_mcp --cov-report=term-missing

# Lint
ruff check src/ tests/
Project Structure
src/matlab_mcp/
├── server.py          # MCP server entry point, tool registration
├── config.py          # YAML config, pydantic validation, env overrides
├── pool/
│   ├── engine.py      # Single MATLAB engine wrapper
│   └── manager.py     # Elastic pool manager
├── jobs/
│   ├── models.py      # Job data model, lifecycle
│   ├── tracker.py     # Job store, pruning
│   └── executor.py    # Sync/async execution, timeout promotion
├── tools/
│   ├── core.py        # execute_code, check_code, get_workspace
│   ├── discovery.py   # list_toolboxes, list_functions, get_help
│   ├── jobs.py        # job status, result, cancel, list
│   ├── files.py       # upload, delete, list files
│   ├── admin.py       # pool status
│   ├── monitoring.py  # get_server_metrics, get_server_health, get_error_log
│   └── custom.py      # Custom tool loader from YAML
├── monitoring/
│   ├── collector.py   # Background metrics sampling, event recording
│   ├── store.py       # Async SQLite storage for time-series data
│   ├── health.py      # Health evaluation (healthy/degraded/unhealthy)
│   ├── routes.py      # HTTP route handlers (/health, /metrics)
│   ├── dashboard.py   # Starlette sub-app with dashboard API
│   └── static/        # Dashboard HTML, CSS, JS (Plotly.js)
├── output/
│   ├── formatter.py   # Result formatting
│   ├── plotly_convert.py       # Load Plotly JSON from MATLAB extraction
│   ├── plotly_style_mapper.py  # MATLAB→Plotly style/property conversion
│   └── thumbnail.py
├── session/
│   └── manager.py     # Session lifecycle, temp dirs
├── security/
│   └── validator.py   # Function blocklist, filename sanitization
└── matlab_helpers/
    ├── mcp_extract_props.m
    ├── mcp_checkcode.m
    └── mcp_progress.m
Security
| Protection | Description |
|---|---|
| Function blocklist | Blocks system(), unix(), dos(), !, eval(), feval(), evalc(), evalin(), assignin(), perl(), python() by default |
| Filename sanitization | Rejects filenames with path traversal or invalid characters |
| Workspace isolation | clear all; clear global; clear functions; fclose all; restoredefaultpath; between sessions |
| SSE proxy auth | Requires reverse proxy with auth for production |
| Upload size limits | Configurable max upload size (default 100MB) |
License
Contributing
Contributions welcome! Please open an issue or PR on GitHub.
Как установить
Выполни в терминале:
claude mcp add hansur94-matlab-mcp-server-python -- npx 

