
Chart Server
БесплатноНе проверенA Model Context Protocol server offering over 15 chart types with Zod schema validation, enabling type-safe chart generation for applications like Claude AI.

Описание
A Model Context Protocol server offering over 15 chart types with Zod schema validation, enabling type-safe chart generation for applications like Claude AI.
README
A Model Context Protocol (MCP) server that provides comprehensive chart generation capabilities. This server offers a wide variety of chart types with comprehensive Zod schema validation for type-safe chart configuration.
Claude.AI Integration (Free Running Version)
For immediate use with Claude.AI without local setup, use these public endpoints:
- Streamable HTTP:
https://chart.mcp.cloudcertainty.com/mcp - Server-Sent Events:
https://chart.mcp.cloudcertainty.com/sse
Simply add either endpoint to your Claude.AI MCP configuration to start generating charts immediately.
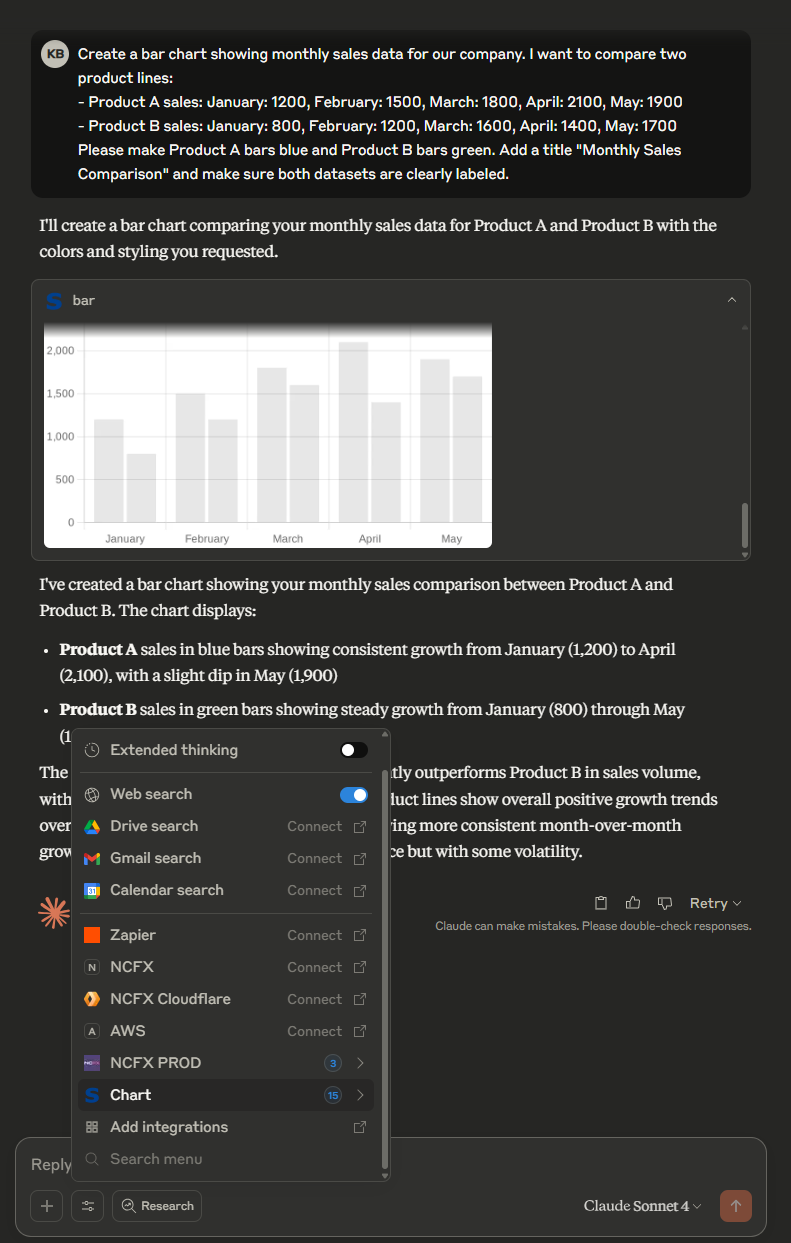
Features
- 🎯 15+ Chart Types - Comprehensive chart library covering all major visualization needs
- 🔒 Type Safety - Full Zod schema validation for all chart configurations
- 🌐 Multiple Deployment Options - Local server, HTTP streaming, and SSE endpoints
- 🚀 Claude.AI Integration - Ready-to-use endpoints for Claude.AI integration
- 📊 Professional Charts - Support for financial, statistical, and business visualizations
Chart Types Supported
Basic Charts
- Bar Chart - Traditional bar charts with multiple datasets
- Line Chart - Line charts with customizable styling and fill options
- Pie Chart - Pie charts with hover effects and custom colors
- Radar Chart - Multi-axis radar charts for comparative analysis
- Polar Area Chart - Radial area charts for cyclical data
Advanced Charts
- Doughnut Chart - Enhanced pie charts with center labels and semi-circle support
- Scatter Plot - X/Y coordinate plotting with optional trend lines
- Bubble Chart - Three-dimensional data visualization with bubble sizes
- OHLC Chart - Financial candlestick charts with volume and indicators
Specialized Charts
- Violin Plot - Statistical distribution visualization
- Gauge Chart - Customizable gauge meters with thresholds
- Radial Gauge - Simple radial progress indicators
- Progress Bar - Linear progress indicators
- Sparkline - Minimal trend visualization
- Sankey Diagram - Flow and process visualization
Quick Start
Local Development
Clone the repository
git clone https://github.com/KamranBiglari/mcp-server-chart.git
cd mcp-server-chart
Install dependencies
npm installBuild the project
npm run buildRun the server
npm start
Usage Examples
Basic Bar Chart
{
  "type": "bar",
  "data": {
    "labels": ["January", "February", "March", "April", "May"],
    "datasets": [
      { "label": "Sales", "data": [50, 60, 70, 180, 190] },
      { "label": "Expenses", "data": [100, 200, 300, 400, 500] }
    ]
  }
}
Financial OHLC Chart
{
  "type": "ohlc",
  "data": {
    "datasets": [
      {
        "label": "MSFT",
        "data": [
          {"x": 1459468800000, "o": 18.23, "h": 19.36, "l": 18.18, "c": 19.31}
        ],
        "color": {"up": "#26a69a", "down": "#ef5350", "unchanged": "#999"}
      }
    ]
  }
}
Advanced Doughnut Chart
{
  "type": "doughnut",
  "data": {
    "labels": ["Complete", "Remaining"],
    "datasets": [{"data": [75, 25], "backgroundColor": ["#4CAF50", "#E0E0E0"]}]
  },
  "options": {
    "circumference": 3.14159,
    "rotation": 3.14159,
    "plugins": {
      "doughnutlabel": {
        "labels": [{"text": "75%", "font": {"size": 24}}]
      }
    }
  }
}
Scatter Plot
{
  "type": "scatter",
  "data": {
    "datasets": [
      {
        "label": "Dataset 1",
        "data": [
          {"x": 2, "y": 4},
          {"x": 3, "y": 3},
          {"x": 5, "y": 8}
        ]
      }
    ]
  }
}
Configuration
MCP Client Configuration
Add to your MCP client configuration:
{
  "mcpServers": {
    "chart-server": {
      "command": "node",
      "args": ["path/to/mcp-server-chart/dist/index.js"]
    }
  }
}
Claude.AI Configuration
For Claude.AI integration, add one of these endpoints:
{
  "mcpServers": {
    "chart-server": {
      "url": "https://chart.mcp.cloudcertainty.com/mcp"
    }
  }
}
Development
Project Structure
src/
├── charts/           # Chart type definitions
│   ├── bar.ts       # Bar chart schema
│   ├── line.ts      # Line chart schema
│   ├── ohlc.ts      # OHLC chart schema
│   └── ...          # Other chart types
├── utils/           # Utility functions
│   ├── index.ts     # Zod to JSON schema conversion
│   └── schema.ts    # Common schema definitions
└── index.ts         # Main MCP server
Building
npm run build      # Build TypeScript
npm run dev        # Development mode with watch
npm run lint       # Run linting
Testing
npm test           # Run test suite
npm run test:watch # Watch mode testing
Chart Type Reference
| Chart Type | Use Case | Data Format |
|---|---|---|
bar |
Categorical comparisons | {labels: string[], datasets: {data: number[]}[]} |
line |
Trends over time | {labels: string[], datasets: {data: number[]}[]} |
pie |
Part-to-whole relationships | {labels: string[], datasets: {data: number[]}[]} |
doughnut |
Enhanced pie charts | {labels: string[], datasets: {data: number[]}[]} |
radar |
Multi-variable comparison | {labels: string[], datasets: {data: number[]}[]} |
polarArea |
Cyclical data | {labels: string[], datasets: {data: number[]}[]} |
scatter |
Correlation analysis | {datasets: {data: {x: number, y: number}[]}[]} |
bubble |
Three-dimensional data | {datasets: {data: {x: number, y: number, r: number}[]}[]} |
ohlc |
Financial data | {datasets: {data: {x: number, o: number, h: number, l: number, c: number}[]}[]} |
violin |
Statistical distributions | {labels: string[], datasets: {data: number[][]}[]} |
gauge |
KPI dashboards | {datasets: {value: number, data: number[]}[]} |
sankey |
Process flows | {datasets: {data: {from: string, to: string, flow: number}[]}[]} |
API Reference
Tools Available
All chart types are available as MCP tools with the following pattern:
- Tool name matches chart type (e.g.,
bar,line,ohlc) - Input schema validates chart configuration
- Returns generated chart data
Schema Validation
Every chart type includes comprehensive Zod schemas that validate:
- Chart type and structure
- Data format and types
- Styling options
- Chart-specific configurations
Contributing
- Fork the repository
- Create a feature branch
- Add your chart type or improvement
- Include tests and documentation
- Submit a pull request
License
MIT License - see LICENSE file for details
Support
- 📚 Documentation: Check the inline schema documentation
- 🐛 Issues: Report bugs via GitHub Issues
- 💬 Discussions: Use GitHub Discussions for questions
- 🌐 Live Demo: Try the public endpoints with Claude.AI
Roadmap
- Real-time data binding
- Custom theme support
- Export formats (PNG, SVG, PDF)
- Animation and interaction options
- Dashboard layout compositions
Установка Chart Server
У этого сервера нет опубликованного пакета — он собирается из исходников. Открой репозиторий и следуй инструкции в README.
▸ github.com/KamranBiglari/mcp-server-chartFAQ
Chart Server MCP бесплатный?
Да, Chart Server MCP бесплатный — установка в пару кликов через Unyly без оплаты.
Нужен ли API-ключ для Chart Server?
Нет, Chart Server работает без API-ключей и переменных окружения.
Chart Server — hosted или self-hosted?
Self-hosted: сервер запускается локально на твоей машине командой из раздела установки.
Как установить Chart Server в Claude Desktop, Claude Code или Cursor?
Открой Chart Server на unyly.org, выбери вкладку своего клиента (Claude Desktop, Claude Code, Cursor) и нажми Install — конфиг сгенерируется автоматически, без правки JSON.
Похожие MCP
Fetch
Web content fetching and conversion for efficient LLM usage.
AWS KB Retrieval
Retrieval from AWS Knowledge Base using Bedrock Agent Runtime.
 автор: modelcontextprotocol
Spring AI MCP Server
Provides auto-configuration for setting up an MCP server in Spring Boot applications.
llm-analysis-assistant
A very streamlined mcp client that supports calling and monitoring stdio/sse/streamableHttp, and can also view request responses through the /logs page. It also
 автор: xuzexin-hz
Compare Chart Server with
Не уверен что выбрать?
Найди свой стек за 60 секунд
Автор?
Embed-бейдж для README
Похожее
Все в категории ai