
rudraneel93/mcp-guardian
БесплатноНе проверенSecurity and governance proxy for MCP infrastructure. Enforces YAML-configurable policies (blocklists, rate limits, token budgets), tracks real token costs via

Описание
Security and governance proxy for MCP infrastructure. Enforces YAML-configurable policies (blocklists, rate limits, token budgets), tracks real token costs via tiktoken, monitors server health with live JSON-RPC probes. Features include OAuth 2.1/OIDC with RBAC, web dashboard with Prometheus metrics, payload normalization against encoding bypasses, semantic shell AST analysis, mTLS zero-trust networking, circuit breakers, and a formal STRIDE threat model. 168 tests across 16 suites. Install: npm install -g @mcp-guardian/server
README
A safety layer between your AI assistant and the tools it uses.
npm version npm downloads Socket Badge Website mcp-guardian MCP server TypeScript MCP SDK License CI
Version 4.1.8 · Website · npm · Install & troubleshooting · Changelog
What's new in 4.1.8
- Incident policy workflow — Enterprise AI investigation drawer can generate, preview, accept, or reject blocking rules from incidents
- npm publish hardening — ordered publish script with registry dep resolution checks and clean-install verification before server goes live
- Dashboard stability — fix React hooks ordering in Security/Health panels that caused error #310 on load
What's new in 4.1.7
- Active Rules controls — Security → Policy now includes list/search, soft disable/enable, and hard delete operations synced to YAML
- Policy runtime semantics —
enabled: falseis honored across rule strategies with backward-compatible defaults - Policy mutation APIs — cloud + local dashboard endpoints for list/toggle/delete with updated README guidance
What's new in 4.1.6
mcp-guardian start— one command for proxy + web dashboard on port 4000 (local dev defaults)mcp-guardian setup— one-shot install for git clones (pnpm install, build, dashboard SPA)- npm tarball — prebuilt dashboard UI (
deploy/dashboard-spa/out/) built at publish time - Install guide — expanded troubleshooting in README and docs/INSTALL.md
What's new in 4.1.5
- npm install — fixes broken
@mcp-guardian/[email protected]registry manifest (workspace:deps). Use 4.1.5+.
What's new in 4.1.4
mcp-guardian onboardfrom global npm — resolves the installed package root (notcwd); writesguardian-configs/under your current directory; shipsscripts/guardian-proxy.shandpolicy-audit.yamlin the npm tarball
What's new in 4.1.3
npm install fix — registry manifest now matches published tarballs (^4.1.3 semver deps, not workspace:). Use @mcp-guardian/[email protected] or later. Publish via ./scripts/publish-npm-all.sh (server/CLI ship from .tgz so metadata stays correct).
What's new in 4.1.1
npm install hygiene — fixes supply-chain scanner findings from 4.1.0:
- Published tarballs no longer include
postinstallor other lifecycle scripts workspace:dependencies are rewritten to semver (^4.1.1) at pack time- Publish all packages via
./scripts/publish-npm-all.sh(core → plugin-sdk → server → cli)
What's new in 4.1.0
Industry roadmap plan compliance — runtime verification and dashboard wiring for all eleven fleet-wide modules (A1–C5, B1–B3):
guardian roadmap audit— CLI +GET /api/agentic/plan-compliance/auditverify every shipped module; exit 0 when production-ready- Dashboard Agentic AI panels — PlanCompliance, Reputation, ZeroTrust, FederatedLearning, Observatory mesh sync, SandboxWizard captured-traffic scorecard, ChainGraph (A1)
- Protection home strip — roadmap compliance score on the main Protection tab with link to Agentic AI
- A1 ONNX graph path — optional fleet chain classifier via
GUARDIAN_FLEET_GRAPH_ONNX_MODEL - B3 MPC-lite masking — pairwise-masked federated gradients (
GUARDIAN_FEDERATED_MPC) - B2/B1 mesh relays — observatory and reputation mesh publish/pull; dev stub via
GUARDIAN_OBSERVATORY_STUB - Docs & env —
guardian roadmap *commands documented; production env vars in.env.example
Run guardian roadmap audit --json or open Agentic AI → Overview in the dashboard to confirm 100% compliance.
What's new in 4.0.0
Industry-standard MCP protection — Guardian moves from per-call filtering to fleet-wide, cross-agent security:
- MTX v1 — open threat exchange format (
@mcp-guardian/mtx) + cloud hub - Guardian Certified MCP — HMAC attestation, persistent registry, verification API
- Multi-step attack chains — collusion detector + session-chain graph with proxy enforcement
- Capability graph & intent binding — tool/resource graph and session intent allowlists
- Agent reputation ledger — persistent scores with proxy enforcement
- Dynamic sandbox tiers — shadow / redact / allow with RL-ready persistence
- Protocol fuzzer — expanded corpus with real block validation and cert gates
- Policy simulator —
/api/policy/simulate+ab_test_policyMCP tool - Incident playbooks & AI investigator — webhook/isolate executors; Threat Lab–linked investigations
- Compliance evidence runner — live policy + audit wired to SOC2/HIPAA/PCI/FedRAMP/ISO mappings
- guardian-bench —
mcp-guardian benchCLI + public leaderboard
See CHANGELOG.md for 3.4.1 production hardening (JWKS refresh, payload limits, SIEM on all block paths, audit retention).
Roadmap (shipped in 4.0): Semantic policy translator with approval flows, config provenance chain, STRIDE/LINDDUN threat modeling, behavioral biometrics, cross-MCP attack chains with SIEM export, digital twin sandbox, zero-trust SPIFFE scoring, decentralized reputation network, ecosystem observatory, insurance risk quantification + PDF export, and federated threat detection — docs/AGENTIC_ROADMAP.md.
Fleet mandate for CISO buyers
Guardian v4 is designed as a fleet-wide control plane, not a single-proxy filter:
- Mandatory policy provenance — every YAML change is hash-chained, signed, and exportable to SIEM/auditors
- Human-in-the-loop policy approval — NL drafts must pass simulation + explicit approval before apply
- Cross-agent attack chain detection — session graphs span servers; alerts export as CEF for Splunk/Datadog
- SPIFFE/mTLS identity — zero-trust composite scores include workload identity from SPIFFE SVIDs
- Cloud observatory + reputation mesh — anonymized fleet telemetry and server reputation consensus via MCP Guardian Cloud
- Insurance-ready risk reports — ALE quantification with underwriter PDF export for cyber insurance workflows
What problem does this solve?
Modern AI assistants (Claude, Cursor, Cline, and others) can connect to tools — read files, run commands, query databases, post to Slack, and more. Those connections often use a standard called MCP (Model Context Protocol).
That power is useful, but risky:
- The AI might read files it should not see.
- It might run shell commands or delete data by mistake or because of a malicious prompt.
- Secrets can leak through tool arguments.
- API costs can spike without you noticing.
MCP Guardian sits in the middle. Every tool request goes through Guardian first. Guardian checks your rules, blocks bad requests, logs what happened, and can show you a live dashboard — before anything reaches your real tools.
Your AI assistant
       │
       ▼
  MCP Guardian  ← reads your rules, blocks bad calls, keeps a log
       │
       ▼
  Your real tools (files, GitHub, database, …)
How it works (step by step)
- You install Guardian and point it at your existing MCP setup (or run
mcp-guardian onboardto do this automatically). - Guardian wraps your tool servers so the AI talks to Guardian instead of talking to them directly.
- When the AI tries to use a tool, Guardian receives the request first.
- Guardian compares the request to your policy (a simple rules file you control).
- If the request is allowed, Guardian forwards it to the real tool and returns the result.
- If the request breaks a rule, Guardian blocks it and tells the AI it was denied — the real tool never runs.
- Every allow and block is saved to a local database so you can review history and see charts on the dashboard.
You stay in control: Guardian does not silently change your rules unless you approve it (for example when reviewing Threat Lab suggestions).
Architecture
This section shows how MCP Guardian is wired together: what runs where, how a tool call flows through governance, and how optional Pro pipelines connect to the proxy.
In this section: System overview · Tool call path · Transports · Agentic AI · Dashboard · Pro pipelines · Learning loop
System overview
When you run mcp-guardian start or pnpm dashboard:proxy, one Node process typically hosts the policy proxy, the dashboard API, and (optionally) agentic services. All components share the same audit database (MCP_GUARDIAN_DB_PATH, default ~/.mcp-guardian/history.db).
flowchart TB
  subgraph clients [AI clients]
    Cursor[Cursor / Cline / Claude]
  end

  subgraph guardian [MCP Guardian process]
    Proxy[Proxy layer\nstdio HTTP SSE WS streamable]
  Policy[PolicyEngine\nYAML + hot reload]
  Agentic[Agentic container\noptional hooks]
  DashboardAPI[Dashboard REST + WebSocket]
  end

  subgraph storage [Persistence]
    SQLite[(history.db)]
    SIEM[SIEM exporters\noptional]
  end

  Upstream[Upstream MCP servers\nfilesystem GitHub etc]

  Cursor --> Proxy
  Proxy --> Policy
  Proxy --> Agentic
  Policy --> Proxy
  Agentic --> Proxy
  Proxy --> Upstream
  Upstream --> Proxy
  Proxy --> SQLite
  Proxy --> SIEM
  DashboardAPI --> SQLite
  clients -.-> DashboardAPI
| Component | Role | Main code |
|---|---|---|
| Proxy layer | Intercepts JSON-RPC; enforces policy on every tools/call |
src/proxy/ |
| Policy engine | Evaluates YAML rules, rate limits, RBAC, patterns | src/policy/ |
| History DB | Stores allow/block audit, tokens, cost | src/database/history-db.ts |
| Dashboard | Local UI + REST API over the same DB | deploy/dashboard-spa/, src/utils/dashboard-server.ts |
| Agentic | Smart features (injection scan, policy gen, trust, etc.) | src/agentic/ |
Enterprise deployments may add Redis (rate limits, DPoP, circuit-breaker sync) and PostgreSQL instead of SQLite — see ENTERPRISE_DEPLOYMENT.md.
Tool call path (tools/call)
Every dangerous decision happens before the real MCP server runs. If Guardian blocks a call, the upstream tool never receives it.
sequenceDiagram
  participant Client as AI client
  participant Transport as Proxy transport
  participant PreGuard as Pre-forward guard
  participant Policy as PolicyEngine
  participant Semantic as Semantic gate
  participant Upstream as Upstream MCP
  participant Audit as Audit queue
  participant SIEM as SIEM log

  Client->>Transport: tools/call JSON-RPC
  Transport->>PreGuard: checkExpandedPayload + agentic hooks
  alt blocked at pre-guard
    PreGuard-->>Client: JSON-RPC error -32001
    PreGuard->>Audit: denied record
    PreGuard->>SIEM: tool_blocked
  else allowed
    PreGuard->>Policy: evaluateAsync context
    alt policy block
      Policy-->>Client: JSON-RPC error
      Policy->>Audit: denied record
      Policy->>SIEM: tool_blocked
    else policy pass
      Policy->>Semantic: sync semantic request gate
      alt semantic block
        Semantic-->>Client: JSON-RPC error
        Semantic->>Audit: denied record
        Semantic->>SIEM: tool_blocked
      else forward
        Semantic->>Upstream: forward request
        Upstream-->>Transport: tool result
        Transport->>Transport: response DLP gate
        Transport-->>Client: JSON-RPC result
        Transport->>Audit: allow record
      end
    end
  end
Integration details:
- Pre-forward guard (src/proxy/tool-call-pre-guard.ts) — caps expanded argument size and runs agentic pre-hooks (prompt injection, etc.) on all transports.
- Policy (src/policy/policy-engine.ts) — your YAML rules; rate-limit counters survive hot-reload via src/policy/rate-limit-store.ts.
- Semantic gate (src/proxy/proxy-post-policy-gates.ts) — optional LLM/heuristic check on arguments before forward.
- Audit — persistCallRecord → async audit-write-queue → SQLite; blocks also emit StructuredLogger.logBlocked for SIEM.
Transports
Guardian implements the same governance stack on every MCP transport your IDE might use:
| Transport | Entry module | tools/call governance |
|---|---|---|
| stdio | src/proxy/proxy-server.ts | Full pipeline (default for wrapped configs) |
| HTTP | src/proxy/http-proxy-server.ts | Full + pre-forward guard |
| SSE | src/proxy/sse-proxy-server.ts | Full + pre-forward guard |
| WebSocket | src/proxy/websocket-proxy-server.ts | Full + pre-forward guard |
| Streamable HTTP | src/proxy/streamable-http-proxy-server.ts | Full + pre-forward guard |
Run mcp-guardian onboard so client configs point at Guardian-wrapped servers. If an IDE connects to an MCP server around Guardian (common with raw SSE URLs), calls are untracked — metrics and logs will show sse_untracked.
Agentic AI integration
Agentic features are optional modules loaded at boot (src/container.ts). They do not replace your YAML policy; they add observation, scoring, and recommendations.
flowchart TB
  subgraph mcp [MCP surface]
    Tools[MCP tools in src/index.ts]
  end

  subgraph container [DI container]
    Core[agentic/core.ts\npipeline scheduler telemetry]
    Features[Feature modules\npolicy gen injection trust mesh]
  end

  subgraph runtime [Runtime integration]
    Hooks[proxy-integration.ts\npre/post call hooks]
    PreGuard[tool-call-pre-guard.ts]
  end

  subgraph ui [Dashboard]
    API[agentic-dashboard-summary.ts]
    Workspace[Agentic AI workspace SPA]
  end

  DB[(agentic tables\nmigration 011)]

  Tools --> Core
  Core --> Features
  PreGuard --> Hooks
  Hooks --> Features
  API --> DB
  Workspace --> API
  Hooks --> DB
| Integration point | What happens |
|---|---|
Every tools/call |
runAgenticPreForwardHooks can block or sanitize arguments when agentic mode is on |
| MCP tools | ~35 agentic tools registered in src/index.ts for automation and dashboard actions |
| Modules | 40+ agentic modules in src/agentic/ (prediction, policy-gen, mesh, collusion, reputation, etc.) |
| Dashboard | Agentic AI workspace reads /api/agentic/* summaries |
| Database | Agentic state in 011-agentic-tables.sql |
Module-level detail: docs/AGENTIC_ARCHITECTURE.md · Shipped features: docs/AGENTIC_FEATURES.md · Roadmap: docs/AGENTIC_ROADMAP.md.
Dashboard and observability
flowchart LR
  Proxy[Proxy writes] --> DB[(history.db)]
  DB --> REST[Dashboard REST API]
  REST --> SPA[Next.js SPA\nProtection Activity Agentic]
  REST --> WS[WebSocket push\nGUARDIAN_WS_ENABLED]
  Proxy --> Prom[Prometheus metrics\noptional]
  Proxy --> SIEM[SIEM exporters\nMCP_GUARDIAN_SIEM_ENABLED]
The dashboard is not a separate database — it reads the same call_records the proxy writes. Set MCP_GUARDIAN_DB_PATH consistently when running pnpm real-life:filesystem or other tests so charts match proxy traffic.
Pro pipeline architecture
These Pro workflows run alongside the live proxy. They consume audit data, swarm reports, and LLM output to improve detection — they do not sit in the hot path of every tool call.
Security Swarm
Automated red-team loop: generate attacks, run the harness, detect bypasses, feed learning.
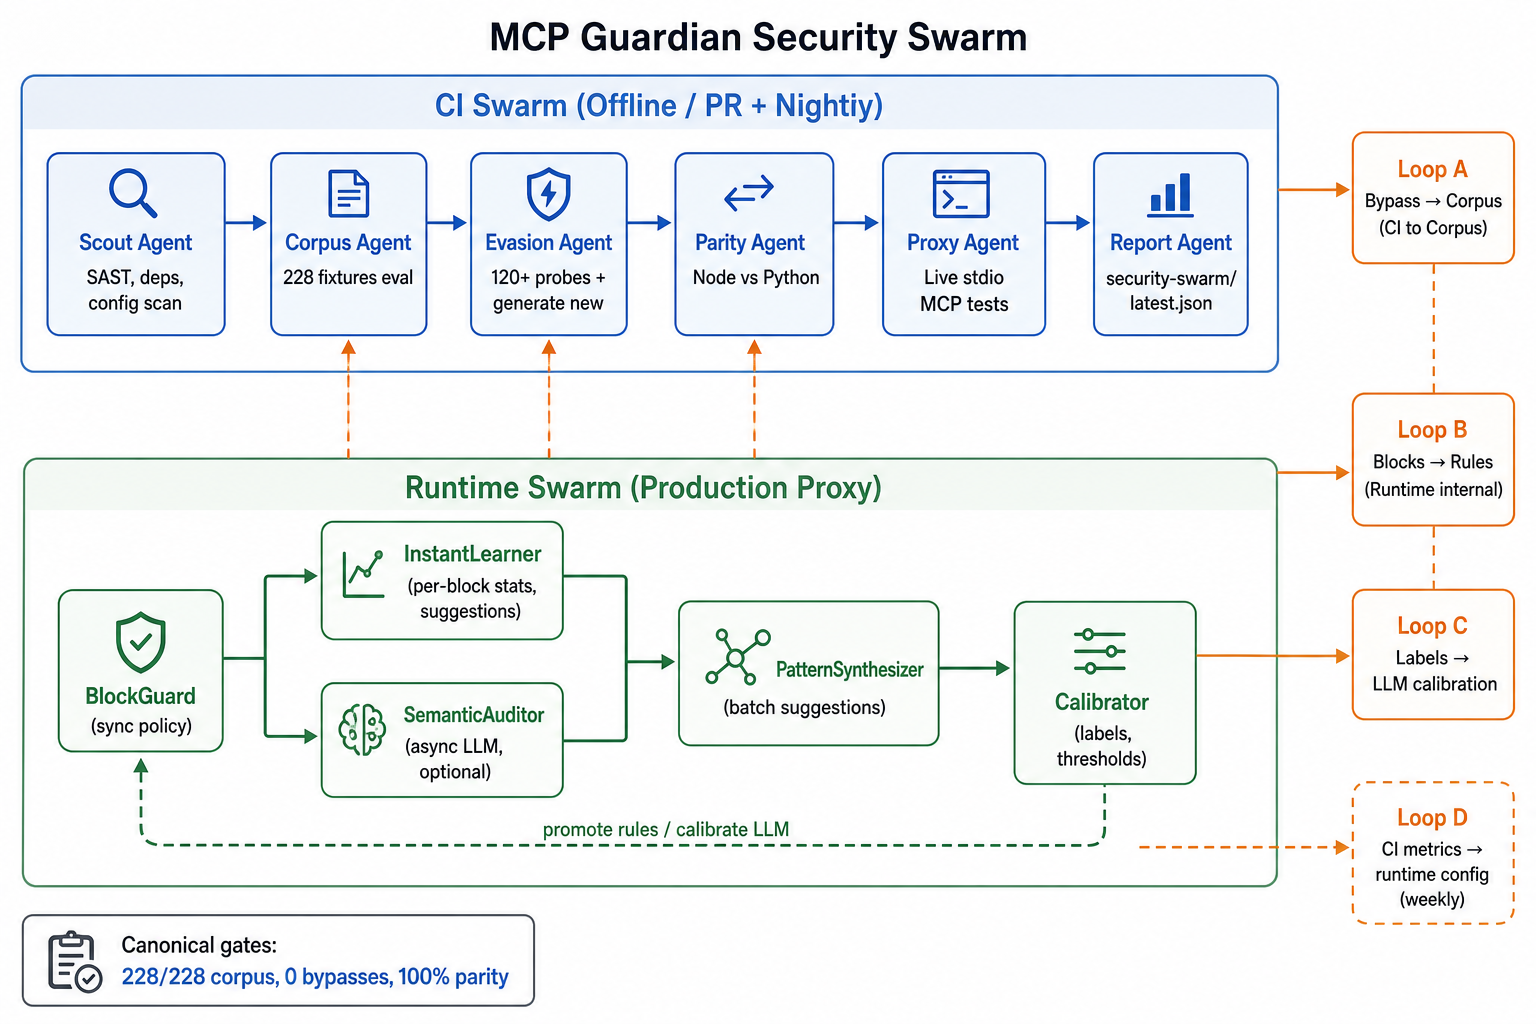
- What it does: Runs scripted steps (build, corpus eval, parity, harness) and records bypasses when policy allows an attack that should be blocked.
- How it connects: Reads/writes under
reports/security-swarm/; bypasses and proposals can inform Threat Lab and runtime attack-learning. - Run:
pnpm security-swarm(Pro license in production).
Threat Lab (LLM discovery)
Human-reviewed LLM proposals for new attack fixtures and policy ideas.
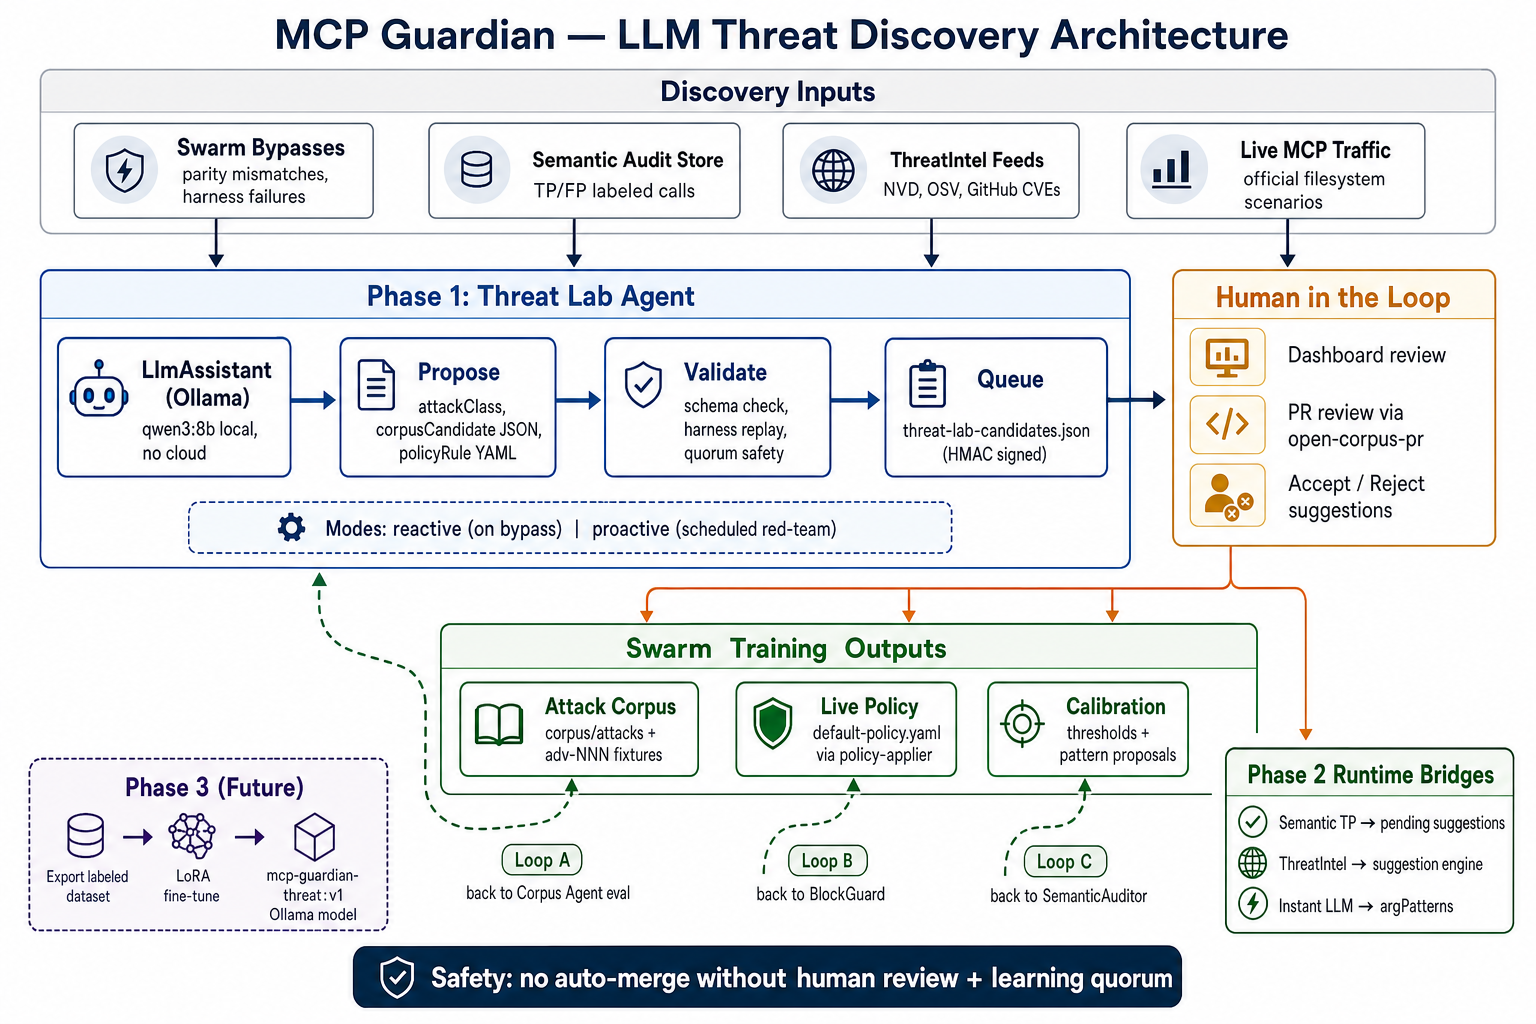
- What it does: Collects signals (bypasses, semantic TPs, ThreatIntel), asks a local LLM for new corpus candidates, validates them, writes
threat-lab-candidates.jsonfor you to accept. - How it connects: Outputs feed the adversarial harness and optional policy-applier after review — nothing is applied silently.
- Run:
pnpm security-swarm:threat-lab(requires Ollama). See THREAT_LAB.md.
Auto Threat Research
Background LLM research when the proxy blocks suspicious traffic; writes validated adv-*.json fixtures.
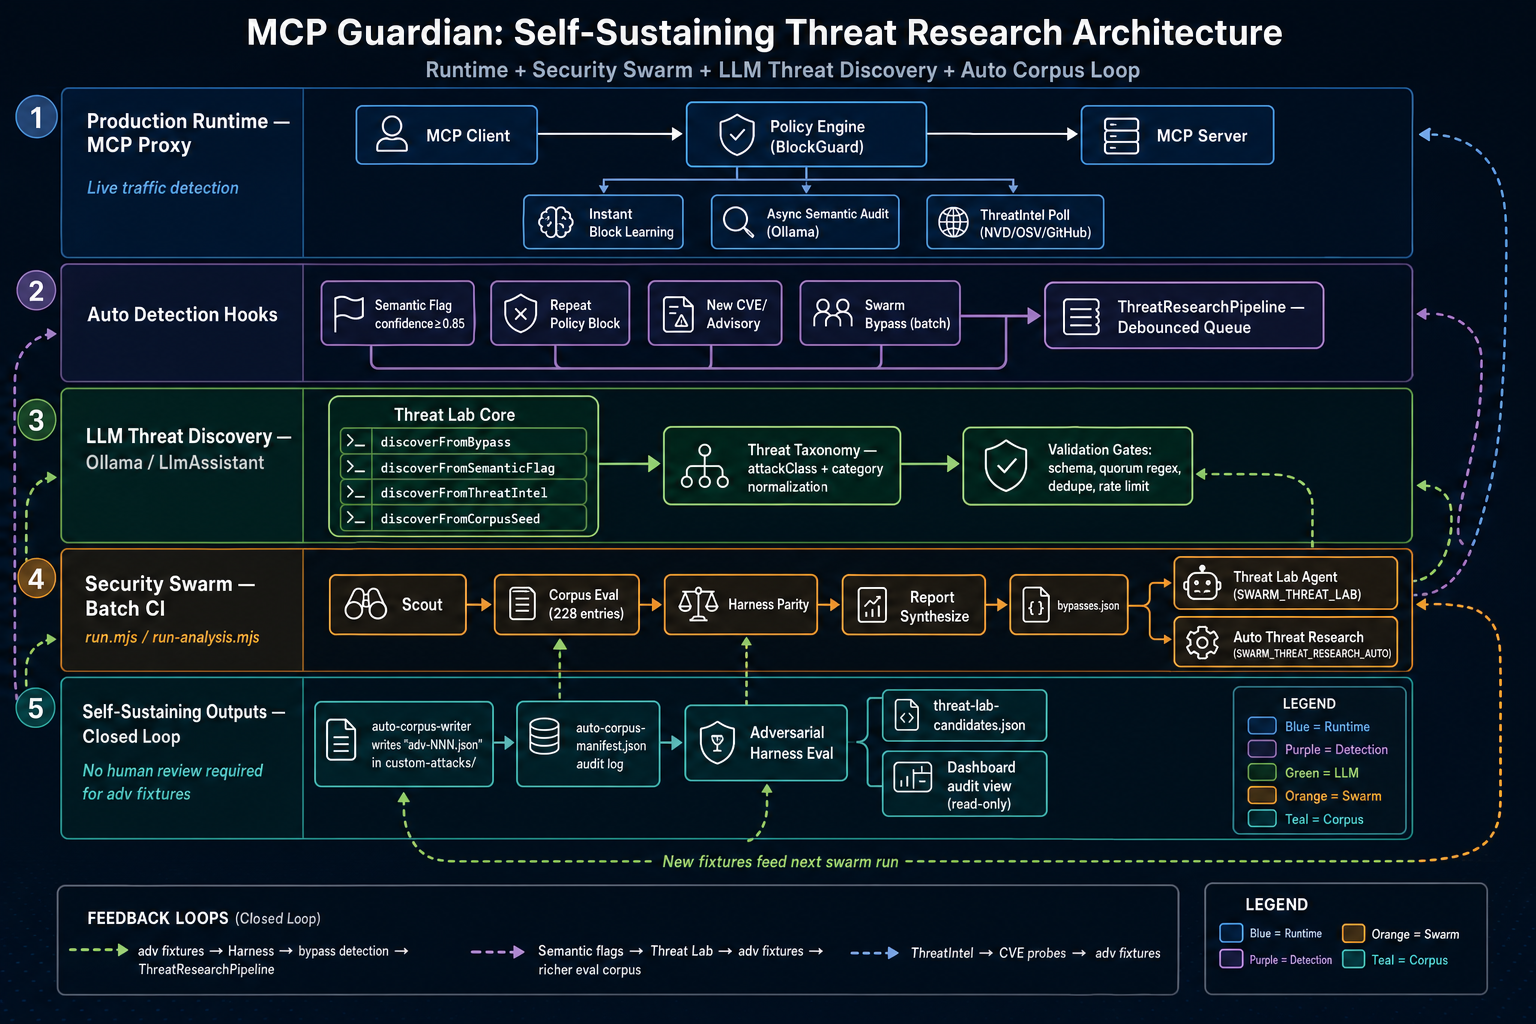
- What it does: Debounces block events, classifies attack types, writes harness fixtures when validation passes (dedupe + rate caps).
- How it connects: Uses the same auto-corpus writer as Threat Lab when both
GUARDIAN_THREAT_RESEARCH_AUTOandSWARM_THREAT_RESEARCH_AUTOare enabled. - Run: Enable env flags on the proxy host; or trigger from dashboard Threat Discovery.
Continuous improvement loop
flowchart LR
  Live[Live proxy blocks] --> Audit[(history.db)]
  Live --> Learn[Attack learning]
  Swarm[Security Swarm] --> Bypasses[bypasses.json]
  Bypasses --> ThreatLab[Threat Lab]
  ThreatLab --> Harness[adversarial harness]
  AutoResearch[Auto Threat Research] --> Fixtures[adv fixtures]
  Fixtures --> Harness
  Harness --> Policy[Policy YAML updates]
  Policy --> Live
Deep dive: docs/ARCHITECTURE.md.
Features explained
Below is what each major capability does, in plain language.
Policy proxy (the core)
What it is: A filter on every tool call.
How it works: You write rules in a YAML file (see The policy file below). Rules can allow specific tools, deny dangerous ones, limit how often tools run, cap token usage, and match patterns in arguments (for example “block if the path contains ../”). When you change the file, Guardian can reload rules without restarting.
Why it matters: This is your main line of defense — fast, predictable, and fully under your control.
Attack blocking (built into the default policy)
What it is: Hundreds of pre-written checks for common abuse.
How it works: Before a call reaches your server, Guardian looks for things like shell commands hidden in arguments, path traversal (../etc/passwd), SQL injection patterns, attempts to exfiltrate secrets, suspicious URLs, and Unicode tricks that hide malicious text. If a pattern matches, the call is blocked and logged.
Why it matters: Many real-world attacks look like normal tool calls; these checks catch a large class of them without an AI model.
Cost tracking
What it is: A running tally of how much your tool usage costs.
How it works: Guardian estimates tokens and dollar cost per call (using model pricing when available). You can set budgets and see burn rate over time in the dashboard.
Why it matters: Runaway agents or loops can get expensive; you see it early.
Health monitoring
What it is: A health check for each connected MCP server.
How it works: Guardian tracks success rate, latency, and whether a server is responding. If a server keeps failing, a circuit breaker can stop hammering it.
Why it matters: You notice broken or flaky integrations before users complain.
Live audit log
What it is: A permanent record of what was allowed and what was blocked.
How it works: Each decision is stored in a local SQLite database (default: ~/.mcp-guardian/history.db). The dashboard reads this database to show tables, charts, and filters.
Why it matters: Security and debugging need a clear trail — who tried what, when, and why it was blocked.
Package scanning (CVE and typo-squat)
What it is: A check on MCP packages before you trust them.
How it works: Guardian can scan installed or configured packages for known security issues (CVEs) and names that look like famous packages but are slightly misspelled (typo-squatting).
Why it matters: Supply-chain attacks often arrive as “almost the right” package name.
Adversarial harness (offline tests)
What it is: A large automated test suite that fires attack-like requests at your policy without a live AI.
How it works: Run pnpm harness from the repo. It replays 800+ fixtures and reports what would be blocked or allowed.
Why it matters: You can change rules and immediately see if you broke legitimate use or left a hole open.
Real-life scenarios (live tests)
What it is: A short or long run of real attack traffic against a real filesystem MCP server through Guardian.
How it works: Commands like pnpm real-life:filesystem drive the official filesystem server with path traversal, injection, and similar tests while the proxy is running. Results show up in the dashboard if you use the same database path.
Why it matters: Offline tests are fast; live tests prove the full path (proxy → policy → log → UI) works.
Agentic AI features (version 4.1)
These are smart assistants inside Guardian that watch, score, and recommend — they do not replace your policy unless you choose to apply a suggestion.
Shipped today
| Feature | What it does for you |
|---|---|
| Threat prediction | Scores how risky each MCP server is and suggests hardening before something breaks. |
| Policy generation | Watches normal tool use, then drafts a tight “only what you actually need” policy you can review. |
| Prompt injection detection | Scans tool arguments for text meant to hijack another AI (heuristic + optional LLM). |
| Threat mesh (MTX) | Opt-in anonymized attack-pattern sharing; @mcp-guardian/mtx open exchange format. |
| Honeypots | Deploys fake decoy servers; probes trigger alerts. |
| Supply chain checks | Publisher verification, dependency confusion, typo-squat detection, SBOM export. |
| Compliance mapping | Maps posture to SOC 2, HIPAA, PCI-DSS, FedRAMP, ISO 27001 with evidence runner. |
| Drift detection | Notices when a server’s tools or behavior change unexpectedly. |
| Red team & protocol fuzzer | Curated and mutated attacks; expanded fuzz corpus with cert gates. |
| Trust protocol & Guardian score | Agent-to-agent negotiation plus local trust scoring. |
| Collusion & attack chains | Multi-step pattern detection across agents/tools (session-chain graph). |
| Capability graph & intent binding | Maps tool/resource relationships; session intent allowlists. |
| Agent reputation | Persistent reputation ledger with proxy enforcement. |
| Sandbox tiers | Dynamic shadow / redact / allow per tool or server. |
| Guardian Certified MCP | HMAC-signed server attestation and verification tiers. |
| Policy simulator | Preview policy impact before deploy (ab_test_policy, REST simulate API). |
| Incident playbooks & investigator | Automated playbook steps; AI incident investigation in the dashboard. |
| MCP lifecycle guard | Session-gated access to tools/list, resources/read, prompts/get. |
| Response DLP | Scans upstream tool responses and streaming output for secrets. |
| RL tuning | Contextual bandits and Thompson sampling for threshold optimization. |
Dashboard: Open Agentic AI in the web UI for overview charts, trust scores, audit tables, and admin tools. See Agentic Features Guide.
Industry-standard roadmap (shipped in 4.0)
Guardian’s industry-standard layer delivers cross-server, cross-agent, systemic protection — what enterprise CISOs need to mandate Guardian fleet-wide. All eleven capabilities shipped in v4.0:
| Tier | Features | Theme |
|---|---|---|
| 1 — Paradigm | A1 Cross-MCP attack chain detection · A2 Digital twin & policy sandbox · A3 Agent behavioral biometrics | See the forest, not just the trees |
| 2 — Ecosystem | B1 Decentralized reputation network · B2 Ecosystem health observatory · B3 Federated threat detection | Network effects across deployments |
| 3 — Enterprise | C1 Config provenance chain · C2 Threat modeling as code (STRIDE/LINDDUN) · C3 Zero-trust continuous verification · C4 Insurance risk quantification · C5 Semantic policy translator | Compliance, CFO, and business stakeholders |
Build order (12 months): Phase 1 (C5, C1, C2, A3) → Phase 2 (A1, A2, C3) → Phase 3 (B1, B2, C4) → Phase 4 research (B3).
Full detail, foundations already in code, and differentiation rationale: docs/AGENTIC_ROADMAP.md.
Verify compliance: Run guardian roadmap audit (or --json for machine-readable output). The dashboard Agentic AI → Overview tab shows the same runtime audit via Industry Roadmap Compliance. Additional CLI utilities: guardian roadmap fleet-graph-train, federated-export|import, observatory-sync, reputation-sync. See Agentic Quickstart.
Production env vars (optional): fleet chain blocking (GUARDIAN_FLEET_CHAIN_BLOCK_CONFIDENCE), multi-region Redis (GUARDIAN_FLEET_REGION), observatory relay or dev stub (GUARDIAN_OBSERVATORY_RELAY_URL, GUARDIAN_OBSERVATORY_STUB), federated learning (GUARDIAN_FEDERATED_LEARNING, GUARDIAN_FEDERATED_MPC), ONNX graph model (GUARDIAN_FLEET_GRAPH_ONNX_MODEL). Full list in .env.example.
The web dashboard
What it is: A local website (default http://localhost:4000) that shows what Guardian is doing.
How it works: When you run mcp-guardian start (or pnpm dashboard:proxy from a git clone), the same process serves the dashboard and the API. The UI reads real data from your history database — not fake demo numbers.
Main areas:
| Area | What you see |
|---|---|
| Protection | Overall status and plain-English analysis of your setup. |
| Activity | Audit log of allowed and blocked calls. |
| Threats | Active threats and quarantine actions. |
| Security | Security score and trends. |
| Operations | Traffic, errors, and cost charts over time. |
| Agentic AI | Autonomous features: trust, threats, policy, operations, audit, and tools. Industry roadmap panels (A1–C5, B1–B3) live here — plan compliance audit on Overview. |
| Settings | Servers, policy, and setup checklist. |
Tip: If charts say “no traffic in this time window,” widen the Time window dropdown (for example Last 7 days). Short windows only show very recent calls.
Security Swarm (Pro)
What it is: A team of automated testers that keep trying to break your policy the way an attacker would.
How it works:
- One track generates and runs attacks, checks for bypasses, and writes reports.
- Another track learns from real blocks on your proxy and improves detection over time.
- The two tracks feed each other so tests get better as your deployment sees real traffic.
Why it matters: Your policy is only as strong as the attacks you have tested against; the swarm expands that set continuously.
Run: pnpm security-swarm (license required in production). Architecture diagram: Architecture § Pro pipeline above.
Threat Lab (Pro)
What it is: Uses a local AI model to propose new attack patterns and rule ideas based on what Guardian has seen.
How it works:
- Collects signals from recent blocks, CVE data, and swarm findings.
- The model suggests new test cases and possible policy lines.
- Automated checks validate proposals.
- You review and approve — nothing is applied automatically.
Run: pnpm security-swarm:threat-lab (needs Ollama or another configured LLM). See THREAT_LAB.md.
Auto Threat Research (Pro)
What it is: Background research when something interesting is blocked.
How it works: When the proxy blocks a suspicious call, events can be queued, grouped, and analyzed by an LLM to classify the attack type and add it to your research corpus. It does not change your live policy by itself — it builds knowledge for you to use later.
Enable with GUARDIAN_THREAT_RESEARCH_AUTO=true when licensed.
Guardian Autopilot (Pro)
What it is: One-command setup: wrap MCP configs, start the proxy, turn on the dashboard, and optional background services (digests, learning).
How it works:
pnpm autopilot:init -- --apply
pnpm autopilot:start
See AUTOPILOT.md.
Free vs Pro
| Free (community) | Pro | |
|---|---|---|
| Policy proxy and YAML rules | Yes | Yes |
| Attack blocking, audit log, cost tracking | Yes | Yes |
| Harness and real-life scenarios | Yes | Yes |
| Full enterprise dashboard | Limited / dev bypass | Yes |
| Security Swarm, Threat Lab, Autopilot | No | Yes |
| Fleet, SSO, Kubernetes, PostgreSQL | No | Yes |
Local development can use GUARDIAN_CI_BYPASS_LICENSE=true with pnpm dashboard:proxy. Production Pro needs a license — PRO_SETUP.md.
Getting started — install, clone, and run
This section walks through every path to a working Guardian: npm install for day-to-day use, git clone for development, and mcp-guardian start (or pnpm dashboard:proxy from the repo) to run the proxy + web dashboard together on port 4000.
npm note:
mcp-guardian start,setup, andonboard --startship in 4.1.6 on GitHub. Ifmcp-guardian startis missing from help, your global install is older than 4.1.6 — use git clone + build below, ornpm install -g @mcp-guardian/[email protected]once published. Full fixes: docs/INSTALL.md.
What you need
| Requirement | Notes |
|---|---|
| Node.js 18+ | Required by @mcp-guardian/server |
| npm | For global install or running the published CLI |
| pnpm | Only if you develop from a git clone (pnpm install, pnpm build) |
| Git | Only for clone-from-source workflow |
| Ollama (optional) | Local LLM at http://127.0.0.1:11434 for semantic detection, Threat Lab, and Auto Threat Research in dev |
Install from npm (recommended for users)
Install the published server package. Pin 4.1.5+ — older 4.1.1–4.1.4 releases had broken workspace: metadata on npm. 4.1.6 adds start / setup (see GitHub master or npm once published).
# Global CLI (mcp-guardian command on your PATH)
npm install -g @mcp-guardian/server@latest

# Or install in a project directory
npm install @mcp-guardian/server@latest
Verify the CLI and install health:
mcp-guardian --version
mcp-guardian doctor
What you get: compiled dist/, default policy templates, prebuilt dashboard static files (deploy/dashboard-spa/out/ in 4.1.6+), and the mcp-guardian CLI (start, onboard, proxy, analyze, doctor, etc.).
Recommended flow after install:
mcp-guardian onboard --apply
mcp-guardian start
Open http://localhost:4000. Or combine: mcp-guardian onboard --apply --start (4.1.6+).
Manual proxy (advanced) — only if you need custom env vars without start:
export DASHBOARD_ENABLED=true
export DASHBOARD_AUTH_DISABLED=true
export GUARDIAN_CI_BYPASS_LICENSE=true
export MCP_GUARDIAN_DB_PATH="$HOME/.mcp-guardian/history.db"
mcp-guardian proxy --config guardian-configs/filesystem.json --policy policy-audit.yaml
Clone and set up for development
Use this when you want the full repo: dashboard SPA, agentic modules, tests, Security Swarm, and pnpm scripts.
git clone https://github.com/rudraneel93/mcp-guardian.git
cd mcp-guardian

# Install workspace dependencies (pnpm is required for the monorepo)
corepack enable
pnpm install

# Copy optional environment overrides
cp .env.example .env
# Edit .env if you need NVD keys, LLM URLs, custom DB path, etc.

# Compile TypeScript + workspace packages + dashboard SPA (first time)
pnpm build
pnpm setup
# setup = pnpm install (if needed) + build + scripts/build-dashboard-spa.sh
# Alternative: pnpm dashboard:build
One-liner after clone (install + build everything):
git clone https://github.com/rudraneel93/mcp-guardian.git && cd mcp-guardian && pnpm install && pnpm build && pnpm setup
Run from the repo without a global install:
node dist/cli.js start
# or after linking: npm link && mcp-guardian start
Configure environment
Guardian reads environment variables at startup. For local development, defaults in scripts/start-dashboard-proxy.sh are usually enough.
cp .env.example .env
| Variable | Purpose | Default (dev) |
|---|---|---|
MCP_GUARDIAN_DB_PATH |
SQLite audit/history DB | ~/.mcp-guardian/history.db |
DASHBOARD_ENABLED |
REST API + web UI | true when using mcp-guardian start or dashboard:proxy |
DASHBOARD_PORT |
Dashboard URL port | 4000 |
DASHBOARD_AUTH_DISABLED |
Skip login on localhost | true in dev script |
GUARDIAN_CI_BYPASS_LICENSE |
Unlock Pro dashboard features locally | true in dev script |
GUARDIAN_LLM_ENABLED |
Semantic / AI features | true in dev script |
OLLAMA_BASE_URL |
Local LLM endpoint | http://127.0.0.1:11434 |
GUARDIAN_WS_ENABLED |
Live WebSocket metrics | true |
Example — use a repo-local database so tests and dashboard share the same file:
export MCP_GUARDIAN_DB_PATH="$PWD/reports/local-history.db"
mkdir -p "$(dirname "$MCP_GUARDIAN_DB_PATH")"
Full reference: .env.example.
Start the dashboard and proxy (recommended)
Primary command (npm global or git clone, 4.1.6+):
mcp-guardian start
Sets local defaults (DASHBOARD_ENABLED, MCP_GUARDIAN_DB_PATH=~/.mcp-guardian/history.db, license bypass for localhost), picks a single-server guardian-configs/*.json (or onboard configsDir), and runs proxy + API + UI.
Custom config or policy:
mcp-guardian start --config guardian-configs/filesystem.json --policy default-policy.yaml
mcp-guardian start --build-dashboard   # git clone: build SPA if out/ missing
From the repo (dev script, same stack + extra dev env):
pnpm dashboard:proxy
# or: pnpm dashboard:proxy -- guardian-configs/filesystem.json default-policy.yaml
What this does:
- Rebuilds
dist/if dashboard-related sources changed (dev script only) - Builds the dashboard SPA (
deploy/dashboard-spa/out/) if missing - Picks a single-server MCP config unless you pass
--config - Starts one Node process that runs:
- the MCP proxy (stdio to your upstream MCP server),
- the dashboard REST API,
- the static web UI at http://localhost:4000/,
- optional agentic schedulers and WebSocket push.
Expected console output:
[dashboard-proxy] DB: /Users/you/.mcp-guardian/history.db
[dashboard-proxy] Dashboard: http://localhost:4000/
[dashboard-proxy] Config: guardian-configs/filesystem.json  Policy: default-policy.yaml  Mode: block
Open the browser → Protection, Activity, Agentic AI, etc. If charts are empty, widen the time window (e.g. Last 7 days) or generate traffic (next section).
Stop: Ctrl+C in the terminal. If port 4000 is stuck: lsof -ti :4000 | xargs kill.
Dashboard UI development (hot reload)
When editing React panels under deploy/dashboard-spa/, run the SPA dev server separately:
# Terminal 1 — proxy + API (backend)
pnpm dashboard:proxy

# Terminal 2 — Next.js dev server for the SPA (frontend hot reload)
pnpm dashboard:dev
For SOC-style split API + UI: pnpm soc:full (API on 4040, SPA dev server — see package.json).
Easiest path: onboard (wrap your AI client)
After npm global install (4.1.6+), let Guardian find and wrap MCP configs for Cursor, Claude Desktop, Cline, and Windsurf:
mcp-guardian onboard --apply
mcp-guardian start
--apply patches your live IDE MCP JSON (with backup). Restart your AI client so traffic flows through Guardian.
If you see “No MCP config found for client auto”:
- Install and configure an IDE with MCP first (Cursor, Cline, Claude Desktop, or Windsurf), or
- Pass a client:
mcp-guardian onboard --client cursor --apply, or - Pass a config file:
mcp-guardian onboard --config /path/to/mcp.json --apply, or - Skip onboard and start with a repo example:
mcp-guardian start --config guardian-configs/filesystem.json
Common config paths (macOS):
| Client | Config file |
|---|---|
| Cline | ~/Library/Application Support/Code/User/globalStorage/saoudrizwan.claude-dev/settings/cline_mcp_settings.json |
| Cursor | ~/.cursor/mcp.json |
| Claude Desktop | ~/Library/Application Support/Claude/claude_desktop_config.json |
From a git clone (before/after build):
pnpm build
pnpm onboard -- --client auto --apply
# or: node dist/cli.js onboard --apply
Run proxy without start (advanced)
Prefer mcp-guardian start — it sets the same env vars automatically. Use proxy directly only when you need full control:
export DASHBOARD_ENABLED=true
export DASHBOARD_PORT=4000
export MCP_GUARDIAN_DB_PATH="$HOME/.mcp-guardian/history.db"
mcp-guardian proxy --config guardian-configs/filesystem.json --policy default-policy.yaml --blocking-mode block
From repo:
node dist/cli.js proxy --config guardian-configs/filesystem.json --policy default-policy.yaml
Without DASHBOARD_ENABLED, you get proxy-only (no web UI). Logs still go to MCP_GUARDIAN_DB_PATH.
Generate test traffic and verify
With mcp-guardian start or pnpm dashboard:proxy running in one terminal:
# Same DB as the proxy (important for dashboard charts)
export MCP_GUARDIAN_DB_PATH="${MCP_GUARDIAN_DB_PATH:-$HOME/.mcp-guardian/history.db}"

# Short live attack smoke test against the official filesystem MCP server
pnpm real-life:filesystem

# Offline policy matrix (no live MCP server required)
pnpm harness

# Plain-English summary of current posture
pnpm analyze

# Industry roadmap module audit (CLI)
node dist/cli.js roadmap audit
# or after global install: mcp-guardian roadmap audit
Refresh http://localhost:4000/ → Activity / Protection should show new events.
Details: scenarios/real-life/README.md.
Guardian Autopilot (one-command fleet setup)
Wraps configs, starts proxy, dashboard, and optional background jobs:
pnpm autopilot:init -- --apply
pnpm autopilot:start
pnpm autopilot:status
See docs/PRO_SETUP.md for production licensing (local dev uses GUARDIAN_CI_BYPASS_LICENSE=true with mcp-guardian start or pnpm dashboard:proxy).
Web dashboard — what you will see
| Tab / area | Purpose |
|---|---|
| Protection | Overall status, roadmap compliance strip (v4.1+) |
| Activity | Audit log of allowed and blocked tools/call |
| Threats | Active threats, quarantine, fleet chain graph (A1) |
| Security | Score, trends, and Policy Studio with Active Rules controls |
| Operations | Traffic, errors, cost charts |
| Agentic AI | Trust, policy gen, observatory, federated learning, plan compliance audit |
| Settings | Servers, policy, setup checklist |
The dashboard reads the same SQLite DB as the proxy (MCP_GUARDIAN_DB_PATH). It is not a separate demo dataset.
In Security → Policy, you can now manage rules without hand-editing YAML:
- Active Rules list with search/filter
- Soft disable/enable (writes
enabled: false/trueon the rule) - Hard delete (removes the rule from
policy.rules[]) - Editor stays in sync with structured actions so YAML remains source-of-truth
Agentic features: docs/AGENTIC_QUICKSTART.md · docs/AGENTIC_FEATURES.md.
Command reference
| Command | What it does |
|---|---|
npm install -g @mcp-guardian/server@latest |
Install published CLI |
mcp-guardian start |
Proxy + dashboard on :4000 (recommended, 4.1.6+) |
mcp-guardian onboard --apply |
Auto-wrap MCP client configs |
mcp-guardian onboard --apply --start |
Onboard then start (4.1.6+) |
mcp-guardian setup |
Dev: pnpm install + build + dashboard SPA |
mcp-guardian doctor |
Validate install, DB, SPA, config |
mcp-guardian proxy --policy … |
Manual proxy (add --config) |
pnpm install && pnpm build |
Dev: install + compile monorepo |
pnpm setup / pnpm dashboard:build |
Dev: build dashboard SPA |
pnpm dashboard:proxy |
Dev: proxy + API + UI (repo script) |
pnpm dashboard:dev |
Dev: SPA hot reload (with proxy running) |
pnpm real-life:filesystem |
Live MCP attack smoke test |
pnpm harness |
Offline adversarial policy matrix |
pnpm analyze |
Plain-English security summary |
pnpm security-swarm |
Pro: continuous adversarial testing |
pnpm autopilot:init / autopilot:start |
Pro: wrap + start full stack |
mcp-guardian roadmap audit |
Verify industry roadmap modules (A1–C5) |
Troubleshooting
| Symptom | Fix |
|---|---|
mcp-guardian start not in help |
Global install is older than 4.1.6. git pull && pnpm build && node dist/cli.js start, or npm install -g @mcp-guardian/server@latest when 4.1.6 is on npm |
unknown option --start |
Same — upgrade to 4.1.6 or run onboard --apply then start separately |
InstallError / workspace: on npm |
Use @mcp-guardian/[email protected]+, not 4.1.1–4.1.4; npm cache clean --force then reinstall |
ETARGET / No matching version for @mcp-guardian/core |
Publish chain incomplete — maintainers run ./scripts/publish-npm-all.sh |
next: command not found (dashboard build) |
npm: reinstall package (prebuilt out/ in 4.1.6). Git: mcp-guardian setup or cd deploy/dashboard-spa && npm install && npm run build |
benchmark-report.json missing` |
git pull — seed file must exist under deploy/dashboard-spa/app/data/ |
pnpm dashboard:proxy not found |
Run from repo root, or use mcp-guardian start globally |
| No MCP config found | mcp-guardian onboard --apply or mcp-guardian start --config guardian-configs/filesystem.json |
| Database disk I/O error | Stop proxy; rm -f ~/.mcp-guardian/history.db-wal history.db-shm history.db.pid; mcp-guardian start |
| Empty dashboard charts | Same MCP_GUARDIAN_DB_PATH as proxy; widen time window; pnpm real-life:filesystem |
| Port 4000 in use | lsof -ti :4000 | xargs kill or DASHBOARD_PORT=4001 mcp-guardian start |
better-sqlite3 errors (pnpm 10) |
pnpm approve-builds → allow better-sqlite3 → pnpm install |
| Ollama warning on start | Optional — ollama serve for semantic / Threat Lab |
| Pro features locked | Production: PRO_SETUP.md. Dev: use mcp-guardian start |
| BundlePhobia / Socket badge | Server package is Node-only; use @mcp-guardian/core for size analysis |
Step-by-step fixes: docs/INSTALL.md · SECURITY.md · docs/REAL_WORLD_INTEGRATION.md (multi-server proxies).
Quick start (summary)
From npm:
npm install -g @mcp-guardian/server@latest
mcp-guardian onboard --apply
mcp-guardian start    # → http://localhost:4000/
From git:
git clone https://github.com/rudraneel93/mcp-guardian.git && cd mcp-guardian
pnpm install && pnpm build && pnpm setup
mcp-guardian start
See Getting started — install, clone, and run and docs/INSTALL.md for the full walkthrough and troubleshooting.
The policy file
Rules live in default-policy.yaml (or a path you set). Example:
version: '1.0'
policy:
  mode: block
  default_action: block

  rules:
    - name: allow-safe-tools
      description: Only allow read-only tools
      action: block
      tools:
        allow:
          - read_file
          - list_directory
          - search

    - name: block-shell-commands
      description: Never let the AI run shell commands
      action: block
      tools:
        deny:
          - bash
          - execute_command
          - eval

    - name: rate-limit
      description: Max 60 tool calls per minute
      action: block
      maxCallsPerMinute: 60
The bundled default policy already blocks many common attack patterns. You can extend it or start from templates in policy-templates/. Full reference: POLICY.md.
Settings you might change
| Variable | Plain meaning |
|---|---|
MCP_GUARDIAN_POLICY |
Path to your rules file |
MCP_GUARDIAN_DB_PATH |
Where call history is stored (share this between proxy and test runners) |
MCP_GUARDIAN_RETENTION_DAYS |
How long to keep audit rows (default 30) |
MCP_GUARDIAN_MAX_PAYLOAD_BYTES |
Max raw JSON-RPC message size (default 10MB) |
GUARDIAN_MAX_EXPANDED_PAYLOAD_BYTES |
Max serialized tool-argument size after decode (default 50MB) |
GUARDIAN_JWKS_REFRESH_MS |
How often to refresh OIDC JWKS (default 5 minutes) |
GUARDIAN_STRICT_ALLOWLIST_RBAC |
Require RBAC on tools.allow policy rules |
GUARDIAN_HEALTH_PROBE_INTERVAL_MS |
Periodic MCP health probes (0 = disabled) |
GUARDIAN_SHUTDOWN_GRACE_MS |
Wait for in-flight calls on shutdown (default 30s) |
GUARDIAN_DB_ENCRYPTION_KEY |
Encrypt sensitive audit fields at rest |
GUARDIAN_DB_ENCRYPT_AUDIT_ARGS |
Also encrypt redacted argument snippets in audit (true + key above) |
MCP_GUARDIAN_SIEM_ENABLED |
Export block/audit events to Splunk, Datadog, webhooks, etc. |
DASHBOARD_PORT |
Dashboard port (default 4000) |
GUARDIAN_DAILY_BUDGET_USD |
Daily spend alert threshold |
GUARDIAN_LLM_PROVIDER / OLLAMA_BASE_URL |
Local AI for semantic checks and Threat Lab |
GUARDIAN_CI_BYPASS_LICENSE |
Local dev only: use dashboard without Pro license |
More: ENTERPRISE_DEPLOYMENT.md for teams, Redis, and multiple servers.
Supported AI clients
Guardian can auto-discover and wrap configs for:
- Cline (VS Code)
- Claude Desktop
- Cursor
- Windsurf
Or pass any MCP config: mcp-guardian proxy --config path/to/config.json.
Documentation map
| Topic | Document |
|---|---|
| Installation & troubleshooting | docs/INSTALL.md |
| Agentic AI (shipped) | docs/AGENTIC_FEATURES.md |
| Agentic AI roadmap | docs/AGENTIC_ROADMAP.md |
| Agentic architecture | docs/AGENTIC_ARCHITECTURE.md |
| MTX threat exchange | docs/MTX_SPEC.md |
| MCP security reference | docs/MCP_SECURITY_REFERENCE.md |
| Autopilot | docs/AUTOPILOT.md |
| Pro license | docs/PRO_SETUP.md |
| Policy reference | docs/POLICY.md |
| Enterprise deploy | docs/ENTERPRISE_DEPLOYMENT.md |
| Architecture | docs/ARCHITECTURE.md |
| Release history | CHANGELOG.md |
License
Community features (proxy, policy, scanning, harness, real-life scenarios) are MIT — see LICENSE and COMMUNITY_SCOPE.md.
Pro features require a license in production: mcp-guardian-cloud.vercel.app. See LICENSE-PRO.
Установка rudraneel93/mcp-guardian
У этого сервера нет опубликованного пакета — он собирается из исходников. Открой репозиторий и следуй инструкции в README.
▸ github.com/rudraneel93/mcp-guardianFAQ
rudraneel93/mcp-guardian MCP бесплатный?
Да, rudraneel93/mcp-guardian MCP бесплатный — установка в пару кликов через Unyly без оплаты.
Нужен ли API-ключ для rudraneel93/mcp-guardian?
Нет, rudraneel93/mcp-guardian работает без API-ключей и переменных окружения.
rudraneel93/mcp-guardian — hosted или self-hosted?
Self-hosted: сервер запускается локально на твоей машине командой из раздела установки.
Как установить rudraneel93/mcp-guardian в Claude Desktop, Claude Code или Cursor?
Открой rudraneel93/mcp-guardian на unyly.org, выбери вкладку своего клиента (Claude Desktop, Claude Code, Cursor) и нажми Install — конфиг сгенерируется автоматически, без правки JSON.
Похожие MCP
GitHub
PRs, issues, code search, CI status
 автор: GitHub
Filesystem
Secure file operations with configurable access controls.
Memory
Knowledge graph-based persistent memory system.
Template MCP Server
A CLI tool to create a new Model Context Protocol server project with TypeScript support, dual transport options, and an extensible structure
 автор: mcpdotdirect
Compare rudraneel93/mcp-guardian with
Не уверен что выбрать?
Найди свой стек за 60 секунд
Автор?
Embed-бейдж для README
Похожее
Все в категории development