
Windows Debugger
БесплатноНе проверенNative Windows debugger with breakpoint management, memory inspection, disassembly analysis, and PE file examination for reverse engineering workflows

Описание
Native Windows debugger with breakpoint management, memory inspection, disassembly analysis, and PE file examination for reverse engineering workflows
README
Introduction
This project is a self-made, lightweight MCP Debugger Server developed for learning and experimentation. The MCP Debugger Server exposes debugger functionality as MCP tools, enabling external MCP clients to control execution, inspect memory, and analyze the debuggee through a clean interface.
The debugger is written in c++ and implements core debugging functionality from scratch without relying on existing debugger frameworks. For instruction decoding the Zydis disassembler is used. The debugger is integrated with an MCP server written in c#, built using the official MCP C# SDK.
Keywords:
MCP server, debugger, disassembler, static analysis, dynamic analysis, debugging, AI, EXE, executable, Windows
Demo
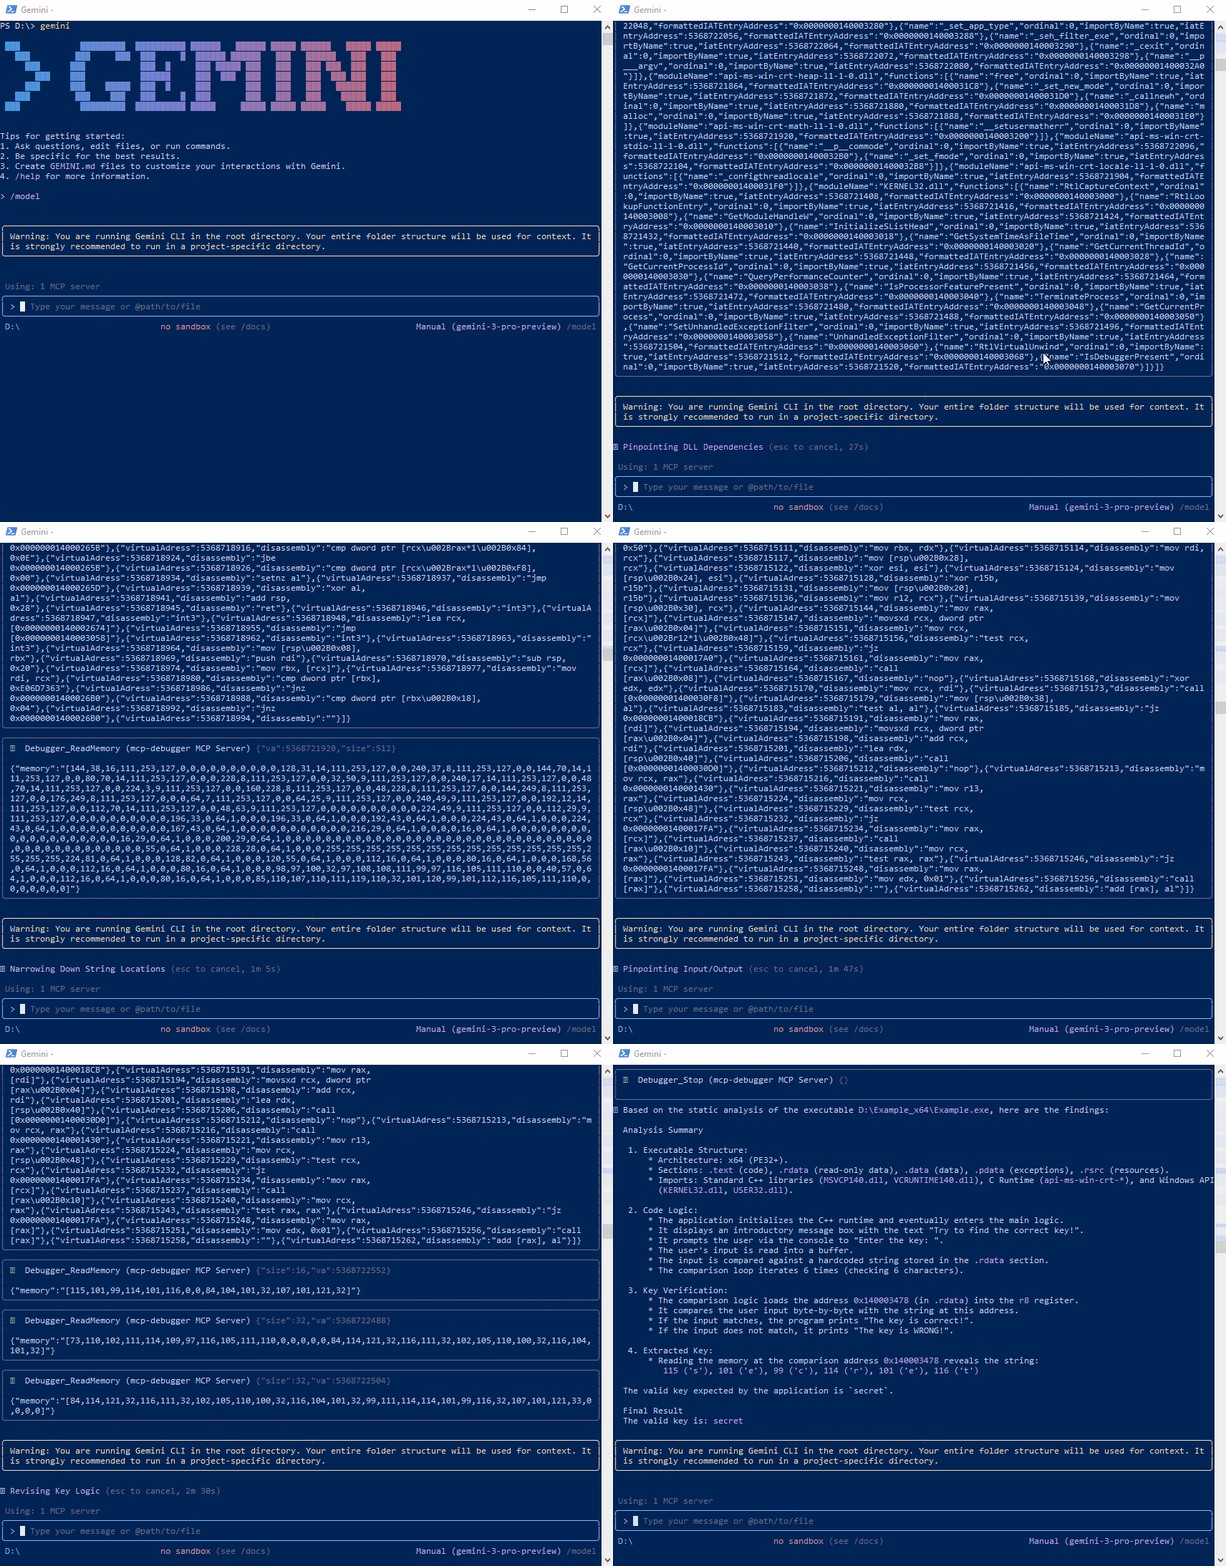
Gemini CLI was used as MCP Client in the Demo
Quickstart: Setting up MCP.Server.exe in VS Code
This guide provides a step-by-step process for building and integrating the MCP.Server.exe into Visual Studio Code on Windows.
Step 1: Build the Solution
Before configuring VS Code, you must compile the mcp server:
- Open
MCPDebugger.slnin Visual Studio. - Build the solution
- Confirm that
MCP.Server.exeexists in your\build\Release\x86or\build\Release\x64subfolder.
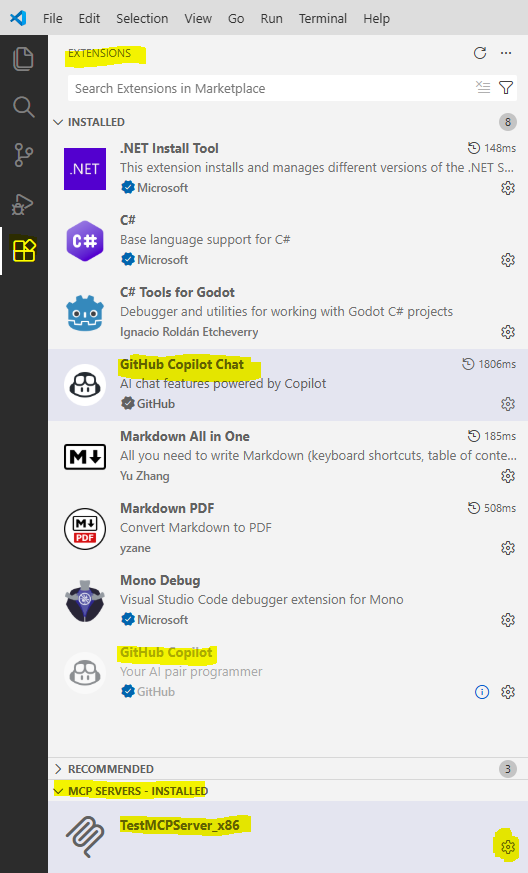
Step 2: Install Required VS Code Extensions
Ensure the following extensions are installed and active in VS Code:
- GitHub Copilot
- GitHub Copilot Chat
Step 3: Add the MCP Server
- Press
Ctrl+Shift+Pto open the Command Palette. - Type
>and select "Add MCP Server". - Choose
command(stdio) as the server type.
Step 4: Configure the Path
Enter the full path to MCP.Server.exe you built in Step 1.
[!CAUTION] Only one architecture (x86 or x64) should be active as MCP server at a time. If you switch architecture, remove the previous server entry first.
| Architecture | Example Path to Enter |
|---|---|
| Windows x64 | C:\YourProject\bin\x64\MCP.Server.exe |
| Windows x86 | C:\YourProject\bin\x86\MCP.Server.exe |
Step 5: Finalize & Use
- Name the Server: Enter a name for the MCP Server and press Enter.
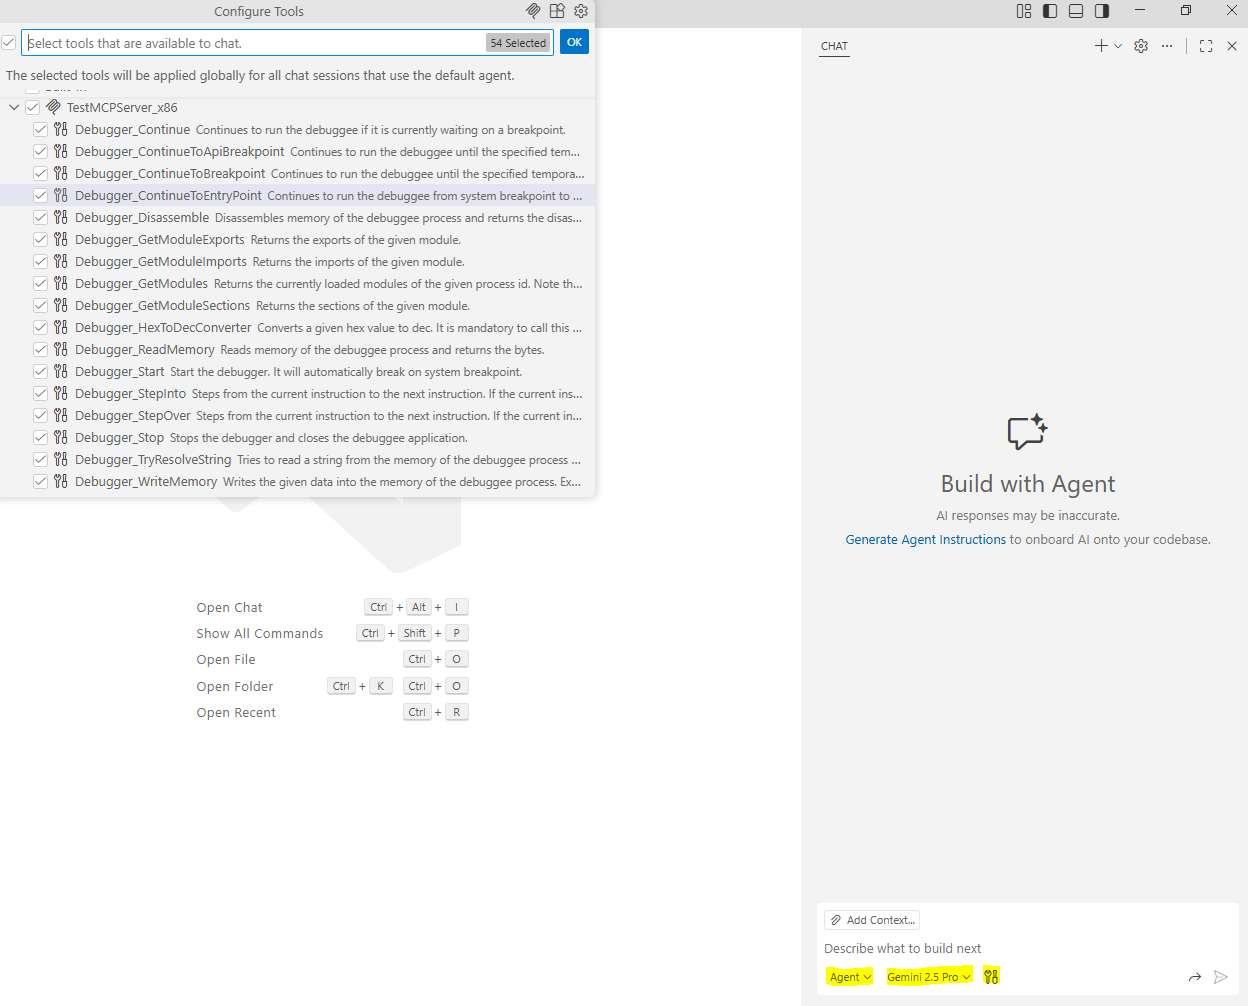
- Verify: Open Copilot Chat (
Ctrl+Alt+I), switch to Agent Mode, and click the Tools icon. Your MCP tools should now be listed and ready for use. MCP tools can be enabled / disabled here.
VS Code Screenshots
VS Code: Toolbar with installed extensions and MCP Server
VS Code: Copilot Chat Window
Model Recommendations
For complex debugging and reverse-engineering tasks using this MCP debugger, Claude Opus 4.5 delivered by far the best results as of November 2025. It consistently handled large execution traces, detailed disassembly, and multi-step reasoning more reliably than other tested models.
ChatGPT 4.1 and Gemini 2.5 Pro were sufficient for simpler analysis scenarios, such as basic stepping, instruction inspection, and straightforward control-flow reasoning. These models performed well for the examples provided in the Example_x64 and Example_x86 folders, but showed limitations when dealing with more complex or long-running debugging sessions.
Model performance may change over time, but the above reflects observed behavior at the time of testing.
Disclaimer
Debugging via MCP can result in high token usage and increased costs. AI interactions are stateless, which means that all relevant debugging context (registers, memory, disassembly, modules, etc.) must be transferred repeatedly with each request.
Operations that frequently stop execution and return detailed state—such as stepping and temporary breakpoints—can significantly amplify token consumption.
If low-cost operation is required, it is strongly recommended to focus on static analysis and disable the following MCP tools:
- Debugger_ContinueToBreakpoint
- Debugger_ContinueToApiBreakpoint
- Debugger_StepInto
- Debugger_StepOver
Disabling these tools reduces the amount of repeated state transfer and helps keep token usage under control.
Examples
The repository includes example projects to help get started with static analysis and debugging and are located in the following folders:
Example_x64 and Example_x86
TheExample_x64andExample_x86projects provide a simple console application used as an introductory debugging target. The application prompts the user to enter a password at runtime. The correct password for both examples is secret.MCP_Debugging_Sessions
A folder containing more complex debugging sessions that leverage dynamic analysis and debugging. In these sessions Claude Opus 4.5 was used. The targets can be downloaded here. Please note that the targets were unpacked usingUPX -dbefore using the MCP Debugger.
MCP Tools
The MCP server exposes the following tools to interact with the debugger:
Debugger Lifecycle
Debugger_Start
Starts the debugger for the specified executable and breaks on the initial system breakpoint.Debugger_Stop
Stops the debugger and terminates the debuggee process.
Execution Control
Debugger_Continue
Continues execution when the debuggee is stopped at a breakpoint.Debugger_ContinueToEntryPoint
Continues execution from the system breakpoint to the program entry point.Debugger_ContinueToBreakpoint
Continues execution until a temporary breakpoint at a specified virtual address is reached.Debugger_ContinueToApiBreakpoint
Continues execution until a temporary breakpoint on a specified API function is reached.Debugger_StepInto
Steps into the next instruction, entering function calls.Debugger_StepOver
Steps over function calls and continues to the next instruction.
Code & Memory Inspection
Debugger_Disassemble
Disassembles memory at a given virtual address and returns instructions including symbol information.Debugger_TryResolveString
Attempts to resolve and read a string from the debuggee’s memory.Debugger_ReadMemory
Reads raw memory bytes from the debuggee process.Debugger_WriteMemory
Writes arbitrary bytes into the debuggee’s memory.
Module Inspection
Debugger_GetModules
Returns a list of currently loaded modules for the debuggee process.Debugger_GetModuleImports
Returns the imported functions of a specified module.Debugger_GetModuleExports
Returns the exported functions of a specified module.Debugger_GetModuleSections
Returns section information of a specified module.
Utilities
- Debugger_HexToDecConverter
Converts hexadecimal values to decimal to avoid number conversion errors.
Solution Overview
The Visual Studio solution is organized into the following projects:
MCP.Debugger
The core debugger implemented in C++. It includes a C++/CLI bridge to expose a managed interface for .NET clients.MCP.Debugger.Tester
A simple WinForms application used to test the debugger through the managed .NET interface.MCP.Debugger.Types
A types assembly that defines shared structures and data types for managed-native transitions between the debugger and .NET clients.MCP.Server
The C# MCP server that exposes debugger functionality as MCP tools for external clients.
Установка Windows Debugger
У этого сервера нет опубликованного пакета — он собирается из исходников. Открой репозиторий и следуй инструкции в README.
▸ github.com/fatmike-gh/mcpdebuggerFAQ
Windows Debugger MCP бесплатный?
Да, Windows Debugger MCP бесплатный — установка в пару кликов через Unyly без оплаты.
Нужен ли API-ключ для Windows Debugger?
Нет, Windows Debugger работает без API-ключей и переменных окружения.
Windows Debugger — hosted или self-hosted?
Self-hosted: сервер запускается локально на твоей машине командой из раздела установки.
Как установить Windows Debugger в Claude Desktop, Claude Code или Cursor?
Открой Windows Debugger на unyly.org, выбери вкладку своего клиента (Claude Desktop, Claude Code, Cursor) и нажми Install — конфиг сгенерируется автоматически, без правки JSON.
Похожие MCP
GitHub
PRs, issues, code search, CI status
 автор: GitHub
Filesystem
Secure file operations with configurable access controls.
Memory
Knowledge graph-based persistent memory system.
Template MCP Server
A CLI tool to create a new Model Context Protocol server project with TypeScript support, dual transport options, and an extensible structure
 автор: mcpdotdirect
Compare Windows Debugger with
Не уверен что выбрать?
Найди свой стек за 60 секунд
Автор?
Embed-бейдж для README
Похожее
Все в категории development