
Ai Assistant
FreeNot checkedMCP-Powered AI Assistant with Pluggable Tools | Python, MCP,FastAPI, LangChain,Ollama, Redis, PostgreSQL, Docker, Prometheus, Grafana Built a single-agent AI as

About
MCP-Powered AI Assistant with Pluggable Tools | Python, MCP,FastAPI, LangChain,Ollama, Redis, PostgreSQL, Docker, Prometheus, Grafana Built a single-agent AI assistant that dynamically discovers and invokes tools exposed as MCP servers, enabling plug-and-play capability extension without code changes.
README
Pluggable AI tools via Model Context Protocol
Python >= 3.11 FastAPI Docker License: MIT PRs Welcome
A modular, production-grade AI agent platform with runtime tool discovery, multi-tool orchestration, and full-stack observability. New capabilities can be added by starting a container — no agent restarts, no code changes, no redeployment.
Built on Anthropic's Model Context Protocol (MCP), this project demonstrates a production-grade architecture for pluggable AI tooling: a LangChain ReAct agent discovers MCP-compatible tool servers over the network, builds LangChain-compatible tool bindings on the fly, and orchestrates multi-step tool chains to answer user queries.
100% local. Runs entirely on your machine with Ollama. No API keys, no cloud costs.
Key Features
- Pluggable Tool Architecture — Each tool server is an independent service with its own container. Add, remove, or update tools without touching the agent.
- Dynamic Tool Discovery — The agent auto-detects MCP servers at runtime via SSE. New tools appear within seconds of a server starting.
- Multi-Tool Chains — The ReAct agent autonomously orchestrates multiple tools in sequence to answer complex queries (e.g., search the web, then summarize, then save a note).
- Smart Caching — Redis caches tool results with configurable TTL. Repeated queries skip the tool call entirely.
- Full Observability — Prometheus metrics (8 instruments) with a pre-built Grafana dashboard covering tool latency, success rates, cache hit ratio, and HTTP performance.
- Conversation Memory — Per-session chat history so the agent remembers context across turns.
- PostgreSQL Logging — Every tool invocation and conversation turn is logged with full analytics endpoints.
- One-Command Deploy —
docker compose upbrings up 10 containers, fully wired.
Architecture
🏗️ Architecture
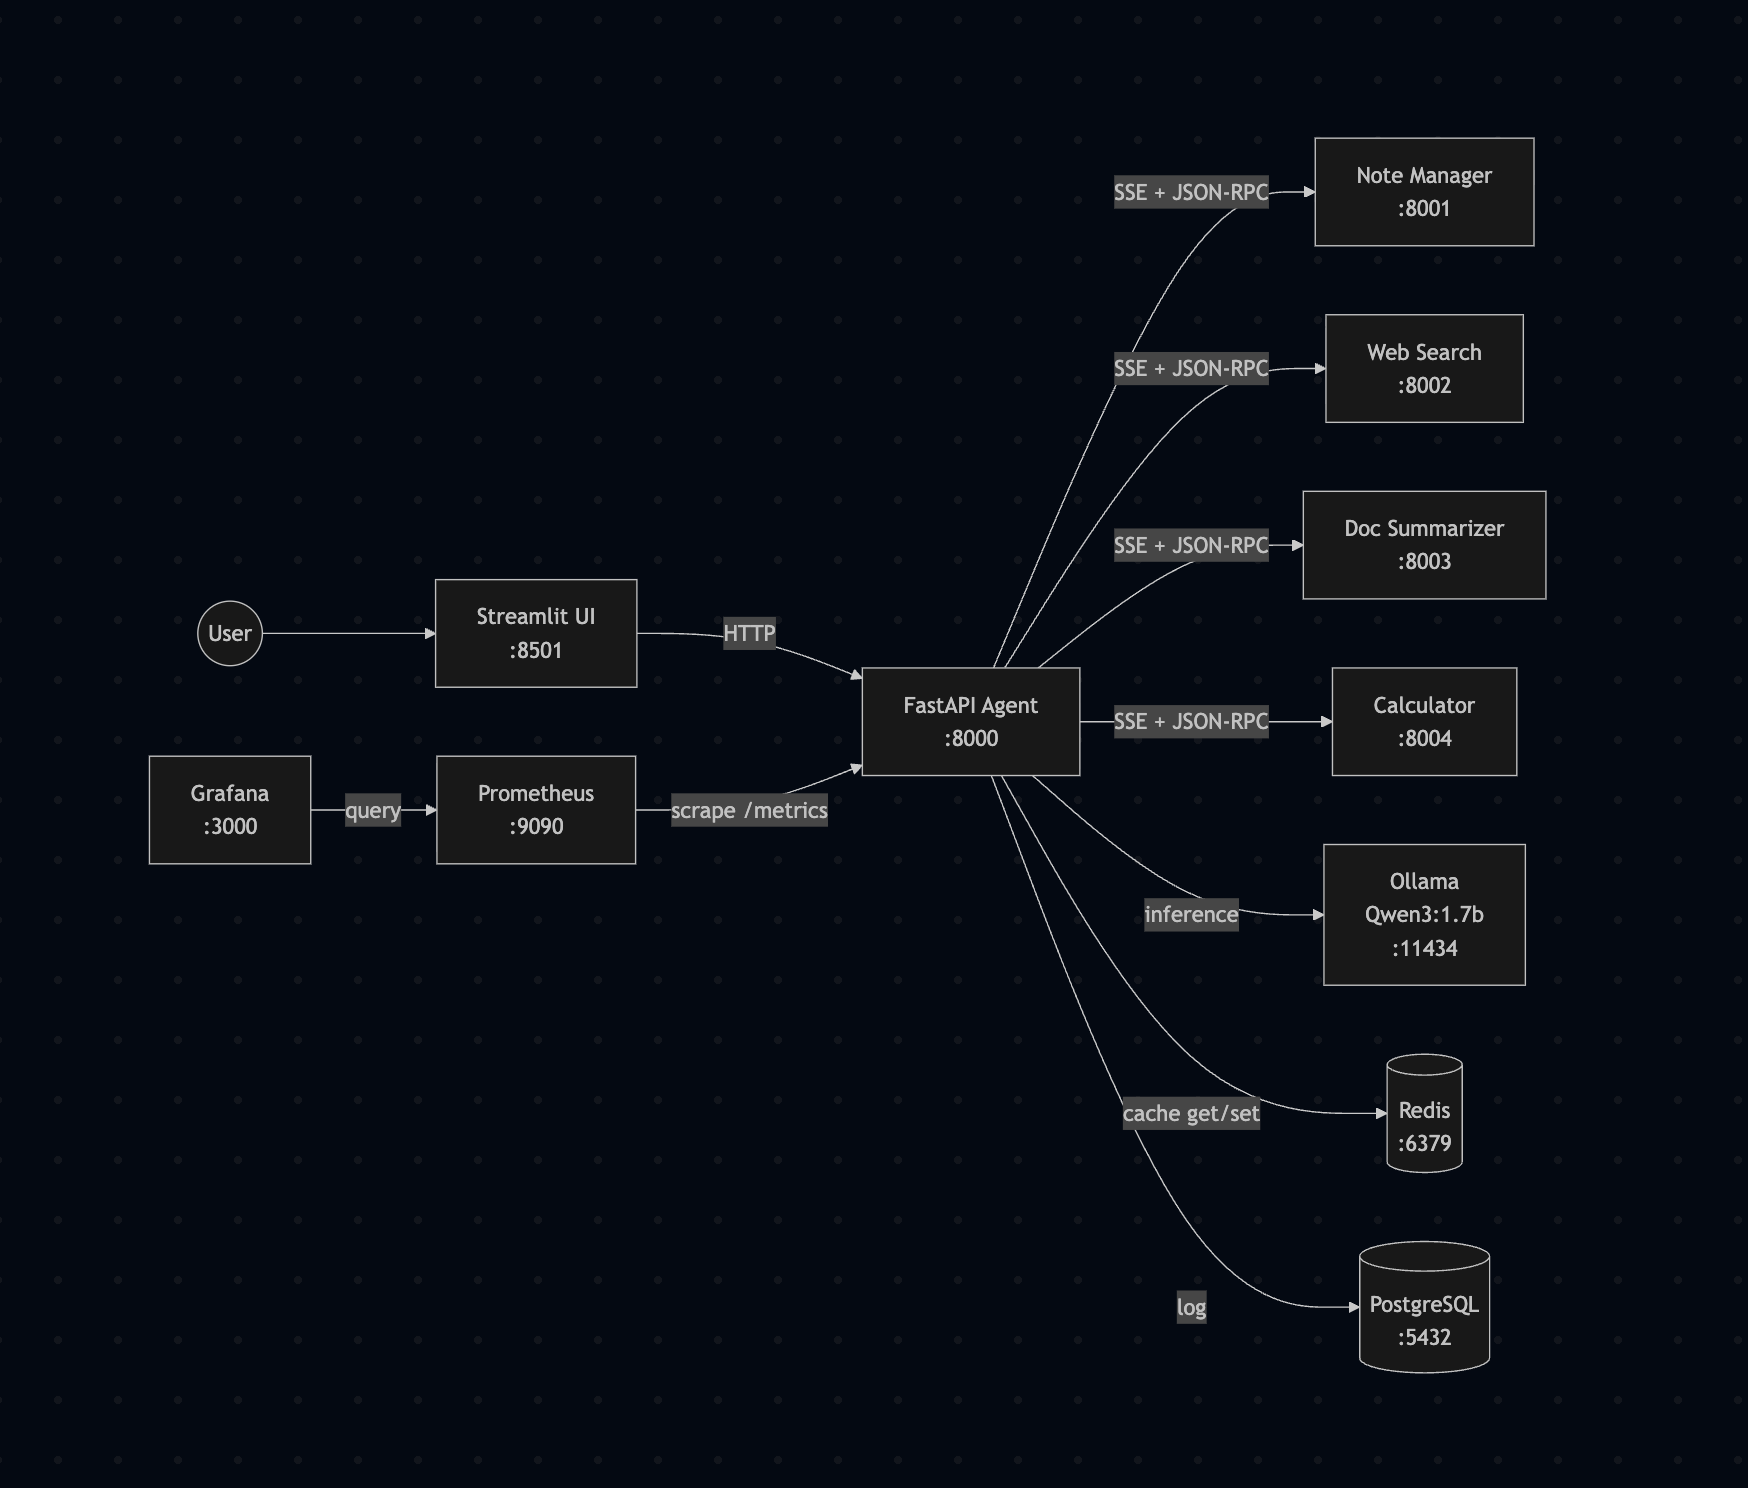
How it works: The agent connects to each MCP server over SSE, calls list_tools() to discover available tools and their JSON schemas, converts those schemas to LangChain-compatible Pydantic models, and binds them as tools for the ReAct agent. When the LLM decides to use a tool, the agent opens an SSE connection to the appropriate server and calls call_tool() with the arguments. Results flow back through the agent to the user.
Tech Stack
| Layer | Technology | Purpose |
|---|---|---|
| LLM | Ollama + Qwen3:1.7b | Local inference, tool calling |
| Agent Framework | LangChain | ReAct agent with tool orchestration |
| API | FastAPI | Async REST API for the agent |
| Tool Protocol | MCP (SSE transport) | Standardized tool discovery and execution |
| UI | Streamlit | Chat interface with analytics dashboard |
| Cache | Redis | Tool result caching with TTL |
| Database | PostgreSQL | Conversation and tool invocation logging |
| Monitoring | Prometheus + Grafana | Metrics collection and visualization |
| Orchestration | Docker Compose | 10-container deployment |
MCP Tool Servers
| Server | Port | Tools | Description |
|---|---|---|---|
| Note Manager | 8001 | save_note, get_notes, search_notes |
Persistent note storage with tag filtering and keyword search |
| Web Search | 8002 | web_search, fetch_url |
DuckDuckGo search and web page content extraction |
| Doc Summarizer | 8003 | summarize_text, extract_key_points |
LLM-powered text summarization and key point extraction |
| Calculator | 8004 | calculate, convert_units |
Safe math evaluation (AST-based) and unit conversion |
Each server also exposes a health_check tool. 13 tools total across 4 servers.
Quick Start
Prerequisites
- Python >= 3.11 (tested with 3.14.2)
- Docker Desktop (4 GB+ RAM allocated)
- Ollama with Qwen3:1.7b pulled
ollama pull qwen3:1.7b
Run
git clone https://github.com/gulabjamun04/mcp-ai-assistant.git
cd mcp-ai-assistant
docker compose up --build -d
Wait ~60 seconds for all services to become healthy, then:
| Service | URL |
|---|---|
| Chat UI | http://localhost:8501 |
| Agent API | http://localhost:8000/docs |
| Grafana | http://localhost:3000 (admin / admin) |
| Prometheus | http://localhost:9090 |
Pull the model into Docker's Ollama
# After containers are up, pull the model into the containerized Ollama
./scripts/pull_model.sh
Dynamic Discovery Demo
See the core value proposition in action — a new tool server is started while the agent is running, and it picks up the new tools automatically:
python scripts/demo.py
Step 1: 10 tools from 3 servers
Step 2: "What is 15% of 250?" → LLM answers alone (no tools)
Step 3: 🚀 Starting calculator container...
Step 4: ✅ 3 new tools discovered → 13 tools from 4 servers
Step 5: Same question → routes to [calculate] tool
Step 6: "Convert 100 km to miles" → [convert_units] tool
Zero code changes. Zero restarts.
API Endpoints
| Method | Endpoint | Description |
|---|---|---|
POST |
/chat |
Send a message, get a response with tool usage info |
GET |
/tools |
List all discovered MCP tools |
POST |
/tools/refresh |
Trigger manual tool re-discovery |
GET |
/health |
Agent and server health status |
GET |
/cache/stats |
Cache hit/miss statistics |
DELETE |
/cache/clear |
Flush cached tool results |
GET |
/analytics/tools |
Tool usage analytics |
GET |
/analytics/sessions |
Session statistics |
GET |
/analytics/recent |
Last 20 tool invocations |
GET |
/metrics |
Prometheus metrics |
Monitoring
The Grafana dashboard (MCP AI Assistant) is auto-provisioned and includes:
| Panel | Metric |
|---|---|
| Total Tool Invocations | mcp_tool_invocations_total |
| Active Sessions | mcp_active_sessions |
| Cache Hit Rate | mcp_cache_operations_total |
| Available Tools | mcp_available_tools |
| Tool Invocations Over Time | rate(mcp_tool_invocations_total[5m]) |
| Average Tool Latency | mcp_tool_duration_seconds |
| Tool Success Rate | Success / total by tool |
| HTTP Request Rate | mcp_http_requests_total |
| Response Time Percentiles | P50 / P95 / P99 |
| Error Rate | 5xx + tool errors |
Access at http://localhost:3000 (admin / admin).
Adding a New Tool Server
The whole point of this architecture is that adding new capabilities is trivial:
1. Create the server — a single Python file using the MCP SDK:
from mcp.server.fastmcp import FastMCP

mcp = FastMCP("my-server", host="0.0.0.0", port=8005)

@mcp.tool()
def my_tool(query: str) -> dict:
    """Tool description for the LLM."""
    return {"result": do_something(query)}

if __name__ == "__main__":
    mcp.run(transport="sse")
2. Create a Dockerfile:
FROM python:3.11-slim
WORKDIR /app
RUN pip install --no-cache-dir mcp
COPY mcp_servers/__init__.py ./mcp_servers/__init__.py
COPY mcp_servers/my_server/ ./mcp_servers/my_server/
EXPOSE 8005
CMD ["python", "-m", "mcp_servers.my_server.server"]
3. Add to docker-compose.yml and agent/config.py.
4. Start it:
docker compose up -d my-server
curl -X POST http://localhost:8000/tools/refresh
5. Done. The agent discovers and uses the new tools immediately.
Project Structure
mcp-ai-assistant/
├── agent/                          # Core AI agent (FastAPI)
│   ├── agent.py                    #   LangChain ReAct agent + session memory
│   ├── cache.py                    #   Redis caching layer
│   ├── config.py                   #   Settings from .env
│   ├── database.py                 #   PostgreSQL logging + analytics
│   ├── main.py                     #   FastAPI app + endpoints
│   ├── mcp_client.py               #   MCP tool registry + discovery
│   └── metrics.py                  #   Prometheus instrumentation
│
├── mcp_servers/                    # MCP tool servers (one per subdirectory)
│   ├── note_manager/               #   Note storage (port 8001)
│   ├── web_search/                 #   Web search + fetch (port 8002)
│   ├── doc_summarizer/             #   Text summarization (port 8003)
│   └── calculator/                 #   Math + unit conversion (port 8004)
│
├── ui/                             # Streamlit chat interface
│   ├── app.py                      #   Entry point
│   ├── api.py                      #   Backend API client
│   └── components/                 #   Chat, sidebar, analytics pages
│
├── monitoring/                     # Observability
│   ├── prometheus/prometheus.yml   #   Scrape config
│   └── grafana/                    #   Dashboard + provisioning
│
├── docker/                         # Docker build files
│   ├── Dockerfile.agent
│   └── init.sql                    #   PostgreSQL schema
│
├── scripts/
│   ├── demo.py                     #   Dynamic discovery demo
│   ├── test_docker.py              #   Docker integration tests
│   ├── pull_model.sh               #   Pull Ollama model into container
│   └── run_local.py                #   Local development launcher
│
├── tests/                          # 161 unit tests
│   ├── test_note_manager.py
│   ├── test_web_search.py
│   ├── test_doc_summarizer.py
│   ├── test_calculator.py
│   ├── test_cache.py
│   └── test_database.py
│
├── docker-compose.yml              # 10-service orchestration
├── requirements.txt
└── .env                            # Environment configuration
Testing
# Run all 161 tests
python -m pytest tests/ -v

# Run a specific server's tests
python -m pytest tests/test_calculator.py -v

# Run Docker integration tests (requires docker compose up)
python scripts/test_docker.py
Key Features
Runtime Tool Discovery — Agent auto-registers MCP servers via SSE and binds JSON-schema-defined tools dynamically.
Zero-Downtime Extensibility — New tool containers are detected and usable within seconds, no agent restart required.
Multi-Step Tool Orchestration — ReAct agent sequences up to 3+ tools per query (e.g., search → summarize → persist).
Distributed Architecture — 4 isolated MCP servers exposing 13 tools across 10 Docker containers.
Production Observability — Prometheus metrics (8 instruments) with Grafana dashboards covering latency (P50/P95/P99), tool success rate, cache metrics, and HTTP throughput.
Cache Optimization Layer — Redis TTL-based caching reduces redundant LLM and tool execution.
Structured Logging & Analytics — PostgreSQL-backed invocation logging with analytics endpoints.
Screenshots
Chat Interface
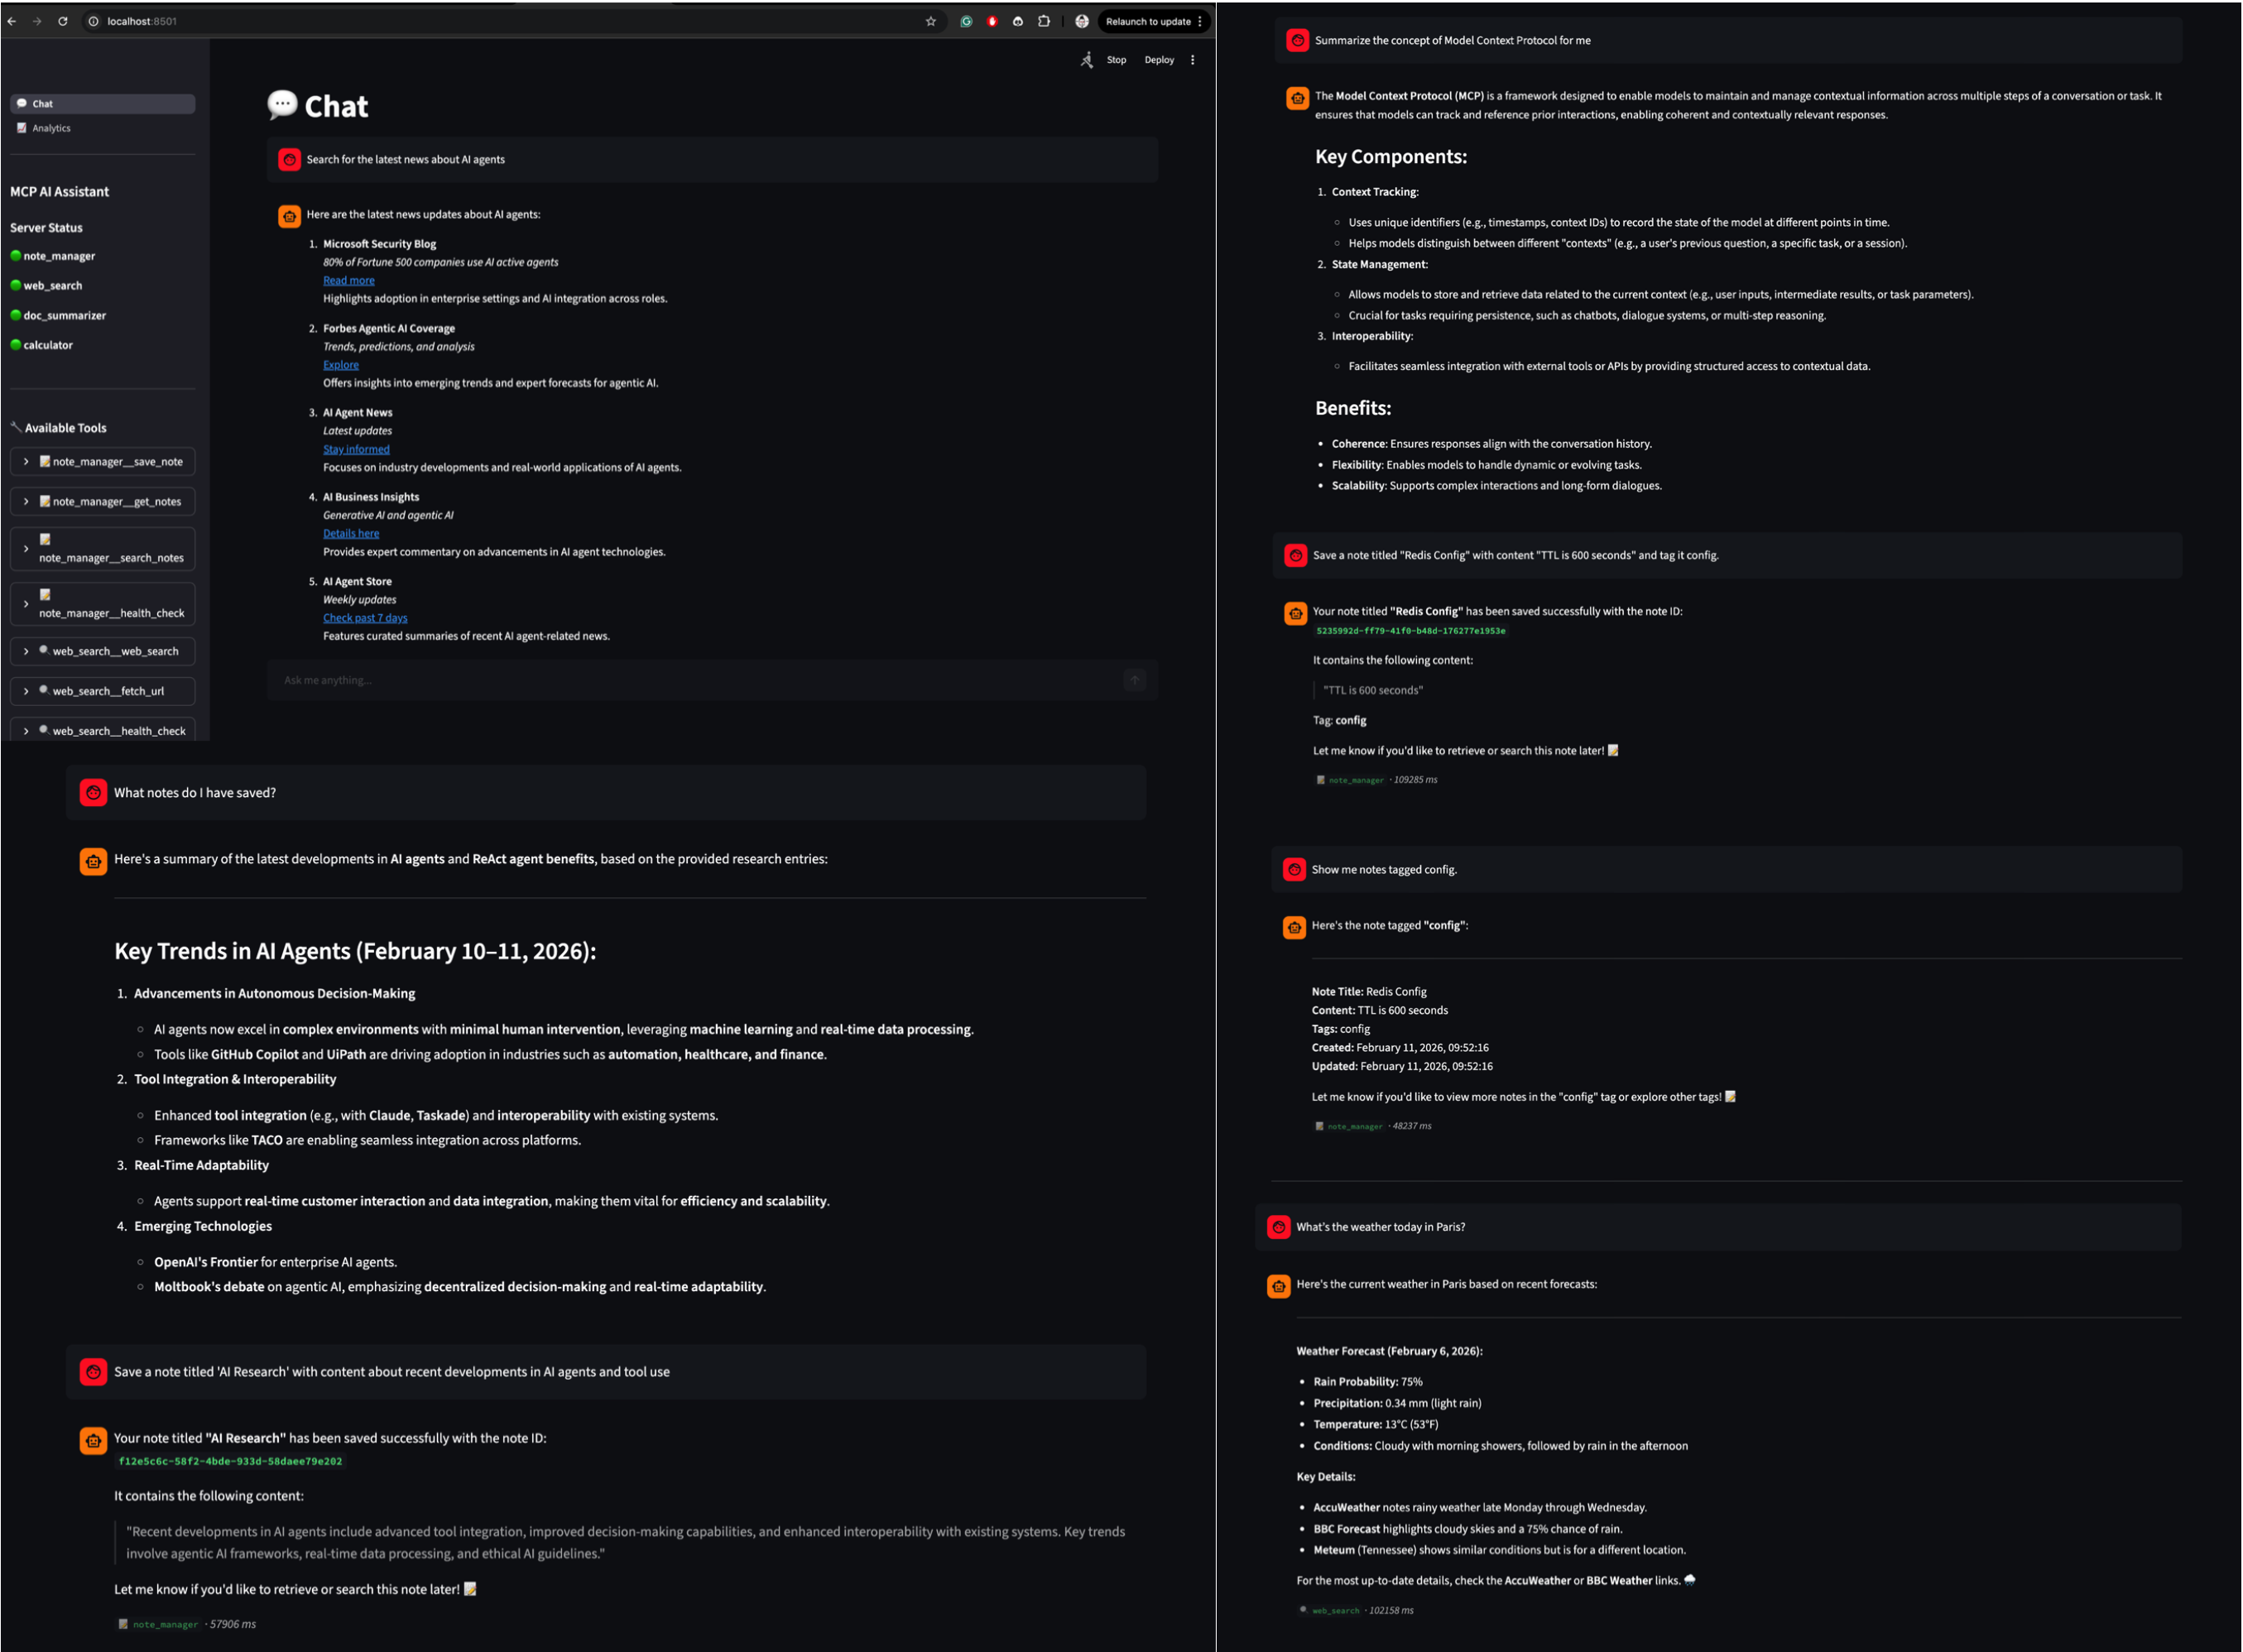
Multi-tool conversations with the ReAct agent — search the web, save notes, summarize documents, and calculate values, all in one session.
Analytics Dashboard
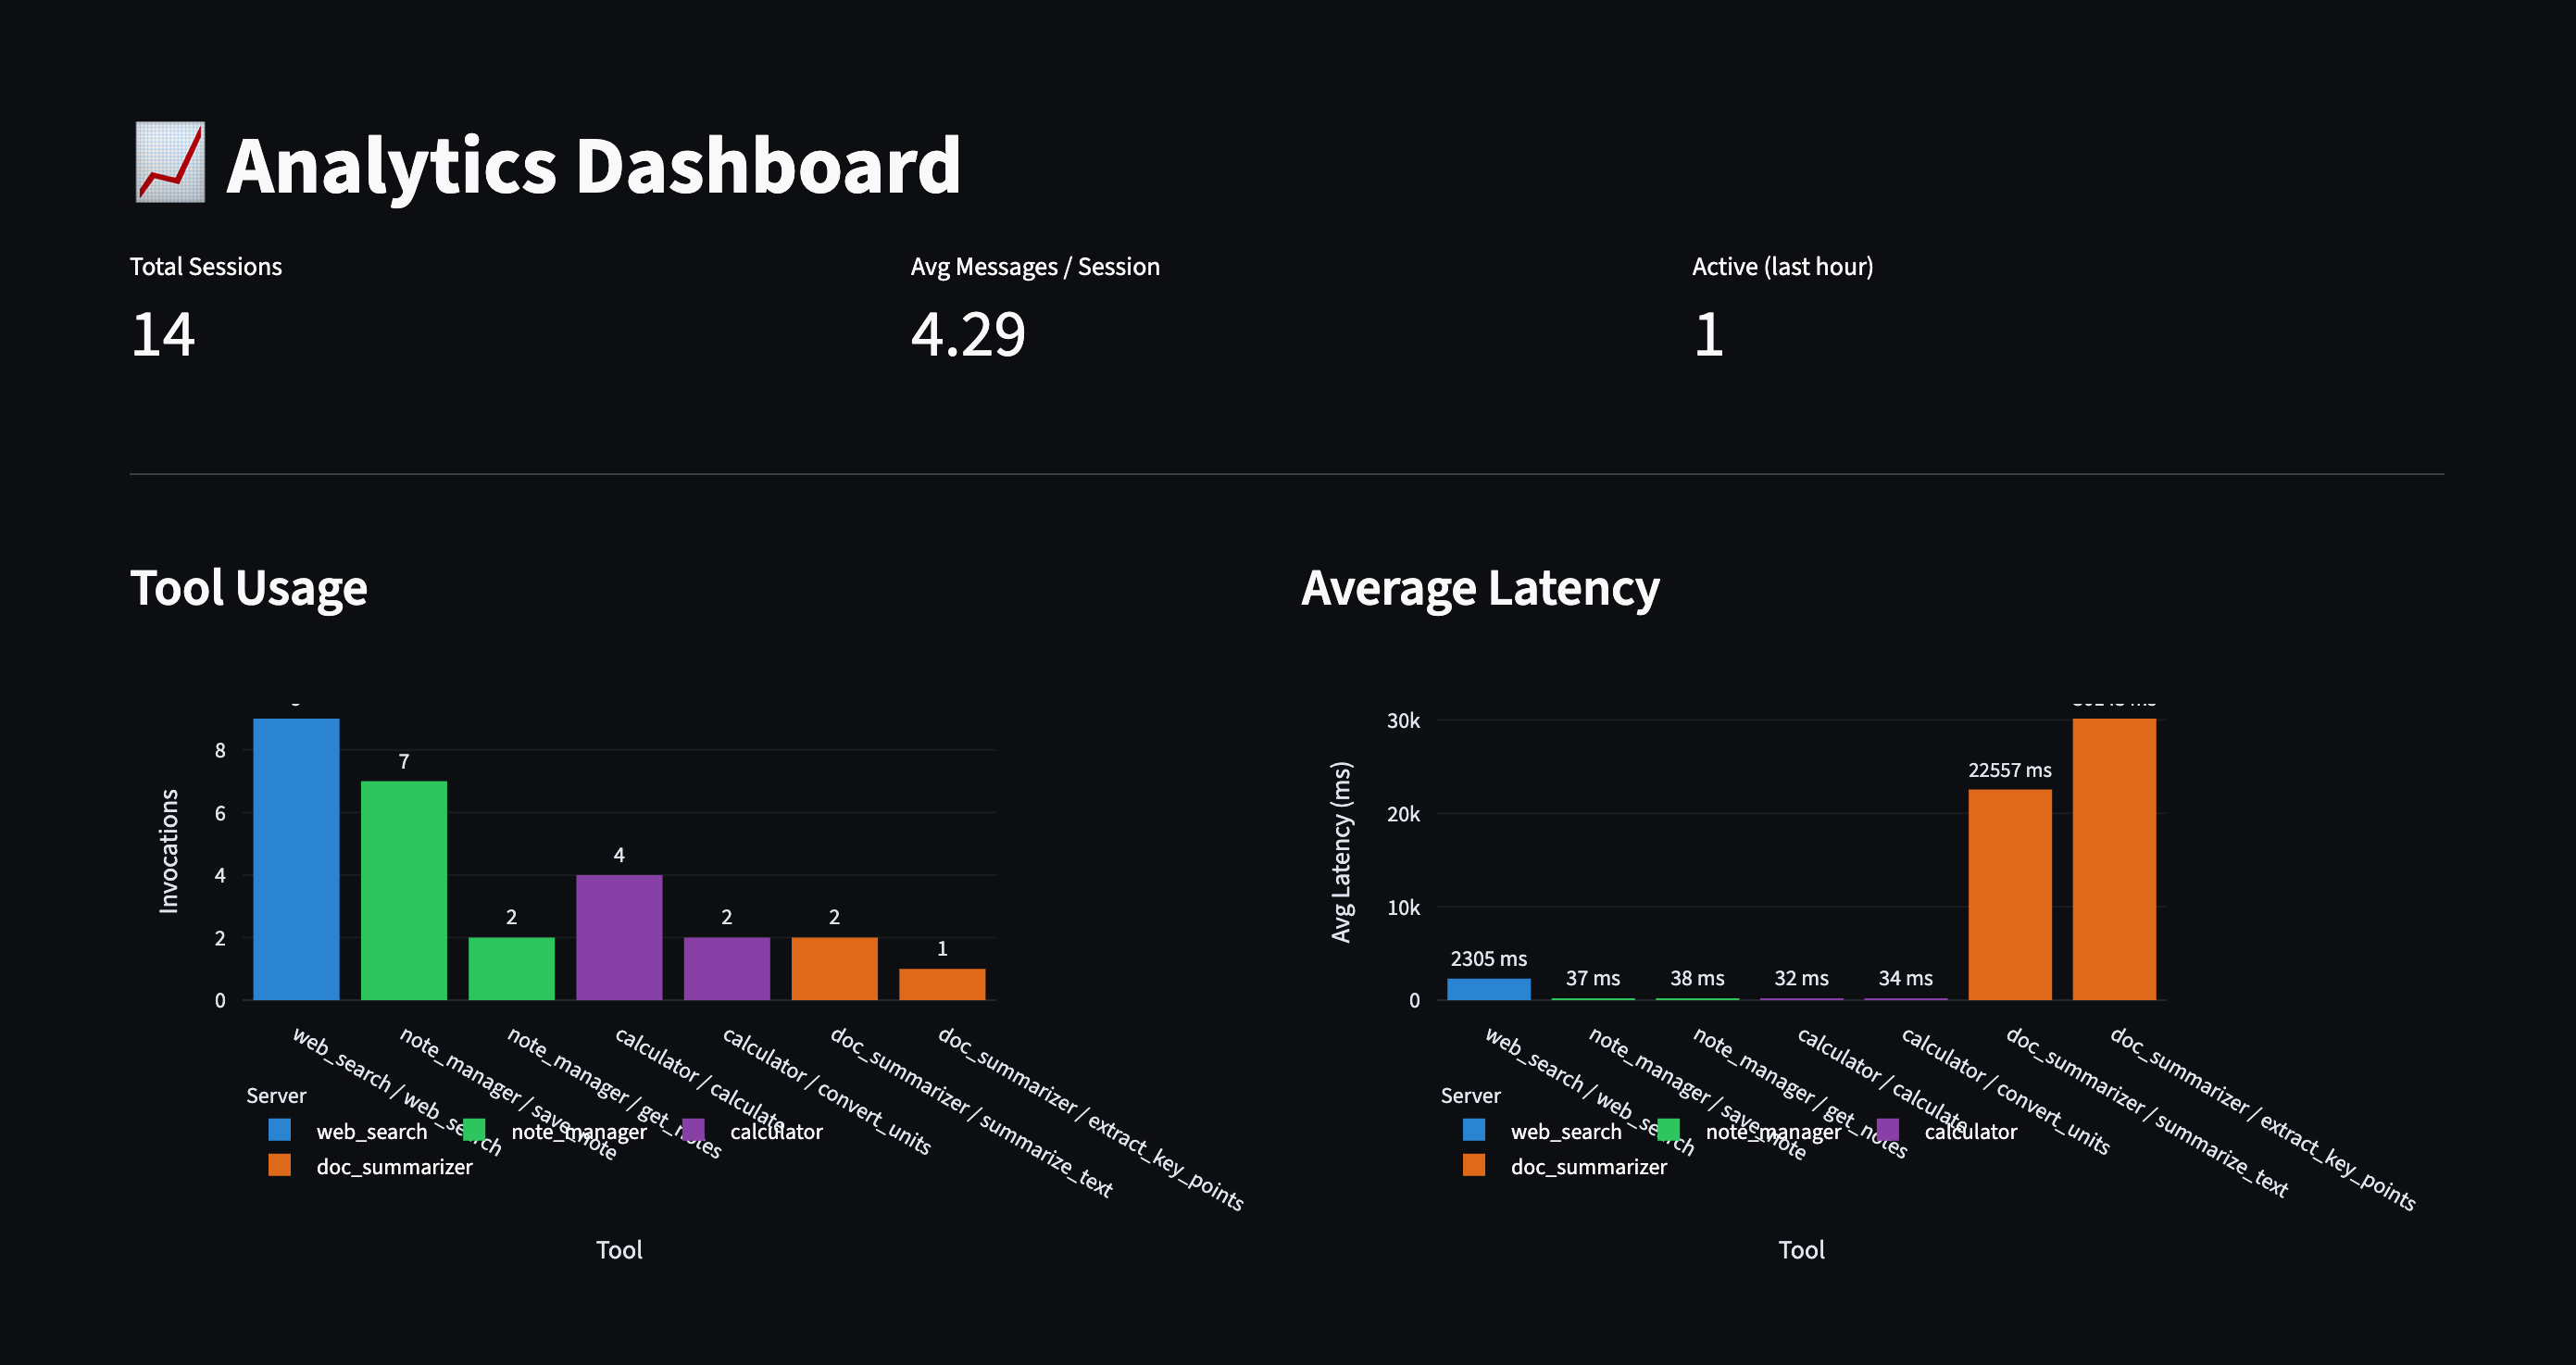
Session metrics, tool usage breakdown, and recent activity — all powered by PostgreSQL logging.
Grafana Monitoring
Real-time observability: tool latency, cache hit rates, HTTP performance, and active sessions.
Monitoring & Observability
The auto-provisioned MCP AI Assistant Grafana dashboard includes:
Total Tool Invocations
Active Sessions
Cache Hit Ratio
Available Tool Count
Tool Success Rate (per tool)
Average Tool Latency
Invocation Rate
HTTP Request Rate
Response Time Percentiles (P50 / P95 / P99)
Error Rate
All metrics are exposed via /metrics and scraped by Prometheus.
Dynamic Tool Discovery
A new MCP server starts and the agent picks up its tools automatically — zero restarts, zero code changes.
▶ Watch Dynamic Discovery Demo
Contributing
Contributions are welcome. To add a feature:
- Fork the repository
- Create a feature branch (
git checkout -b feature/my-feature) - Write tests for your changes
- Ensure all tests pass (
python -m pytest tests/ -v) - Open a pull request
License
This project is licensed under the MIT License. See LICENSE for details.
Author
Shivesh Dave
Installing Ai Assistant
This server has no published package — it is built from source. Open the repository and follow its README.
▸ github.com/gulabjamun04/mcp-ai-assistantFAQ
Is Ai Assistant MCP free?
Yes, Ai Assistant MCP is free — one-click install via Unyly at no cost.
Does Ai Assistant need an API key?
No, Ai Assistant runs without API keys or environment variables.
Is Ai Assistant hosted or self-hosted?
Self-hosted: the server runs locally on your machine via the install command above.
How do I install Ai Assistant in Claude Desktop, Claude Code or Cursor?
Open Ai Assistant on unyly.org, pick your client tab (Claude Desktop, Claude Code, Cursor) and press Install — the config is generated automatically, no JSON editing.
Related MCPs
wenb1n-dev/SmartDB_MCP
A universal database MCP server supporting simultaneous connections to multiple databases. It provides tools for database operations, health analysis, SQL optim
 by wenb1n-dev
Postgres Server
This server enables interaction with PostgreSQL databases through the Model Context Protocol, optimized for the AWS Bedrock AgentCore Runtime. It provides tools
 by madhurprash
Postgres
Query your database in natural language
 by Anthropic
PostgreSQL
Read-only database access with schema inspection.
by modelcontextprotocolCompare Ai Assistant with
Not sure what to pick?
Find your stack in 60 seconds
Author?
Embed badge for your README
Browse similar
All data MCPs