
Chartjs
FreeNot checkedA Model Context Protocol (MCP) server for generating charts using Chart.js

About
A Model Context Protocol (MCP) server for generating charts using Chart.js
README
npm version npm downloads license
A Model Context Protocol (MCP) server that generates beautiful charts using Chart.js v4. Perfect for data visualization in Claude Desktop, Cursor, and other MCP-compatible applications.
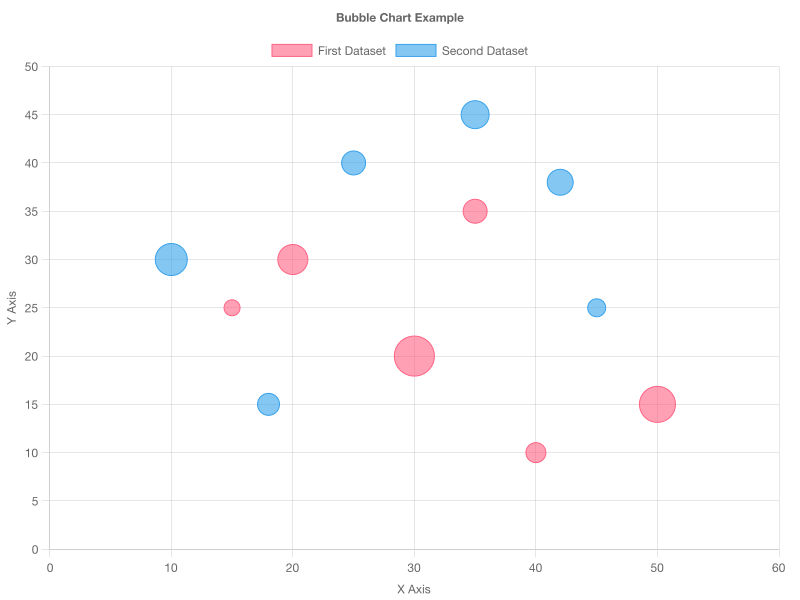 Just ask "Create a bubble chart showing company performance" and get professional results instantly!
📦 NPM Package
- Name:
@ax-crew/chartjs-mcp-server - Version:
3.2.0 - Node:
>=18 - CLI bin:
chartjs-mcp-server - NPM: @ax-crew/chartjs-mcp-server
Install
# npm
npm install -D @ax-crew/chartjs-mcp-server

# pnpm
pnpm add -D @ax-crew/chartjs-mcp-server

# yarn
yarn add -D @ax-crew/chartjs-mcp-server

# bun
bun add -d @ax-crew/chartjs-mcp-server
Run
# via npx (recommended for MCP clients)
npx @ax-crew/chartjs-mcp-server

# or if installed locally/globally
chartjs-mcp-server
🎯 What This Does
Transform your data into beautiful, professional charts instantly! This MCP server connects to your favorite AI applications and generates:
- 📊 Bar Charts - Perfect for comparing categories
- 📈 Line Charts - Great for showing trends over time
- 🥧 Pie & Doughnut Charts - Ideal for showing proportions
- 🎯 Scatter & Bubble Charts - Perfect for correlation analysis
- 🕸️ Radar Charts - Great for multi-dimensional comparisons
- 🌟 Polar Area Charts - Beautiful radial visualizations
All charts can be generated as:
- 📸 PNG Images (800x600px) - Perfect for saving, sharing, or embedding
- 🌐 Interactive HTML - Self-contained divs with hover tooltips and animations
- 🧩 JSON Config - Raw Chart.js config for client-side rendering in React/Next.js apps
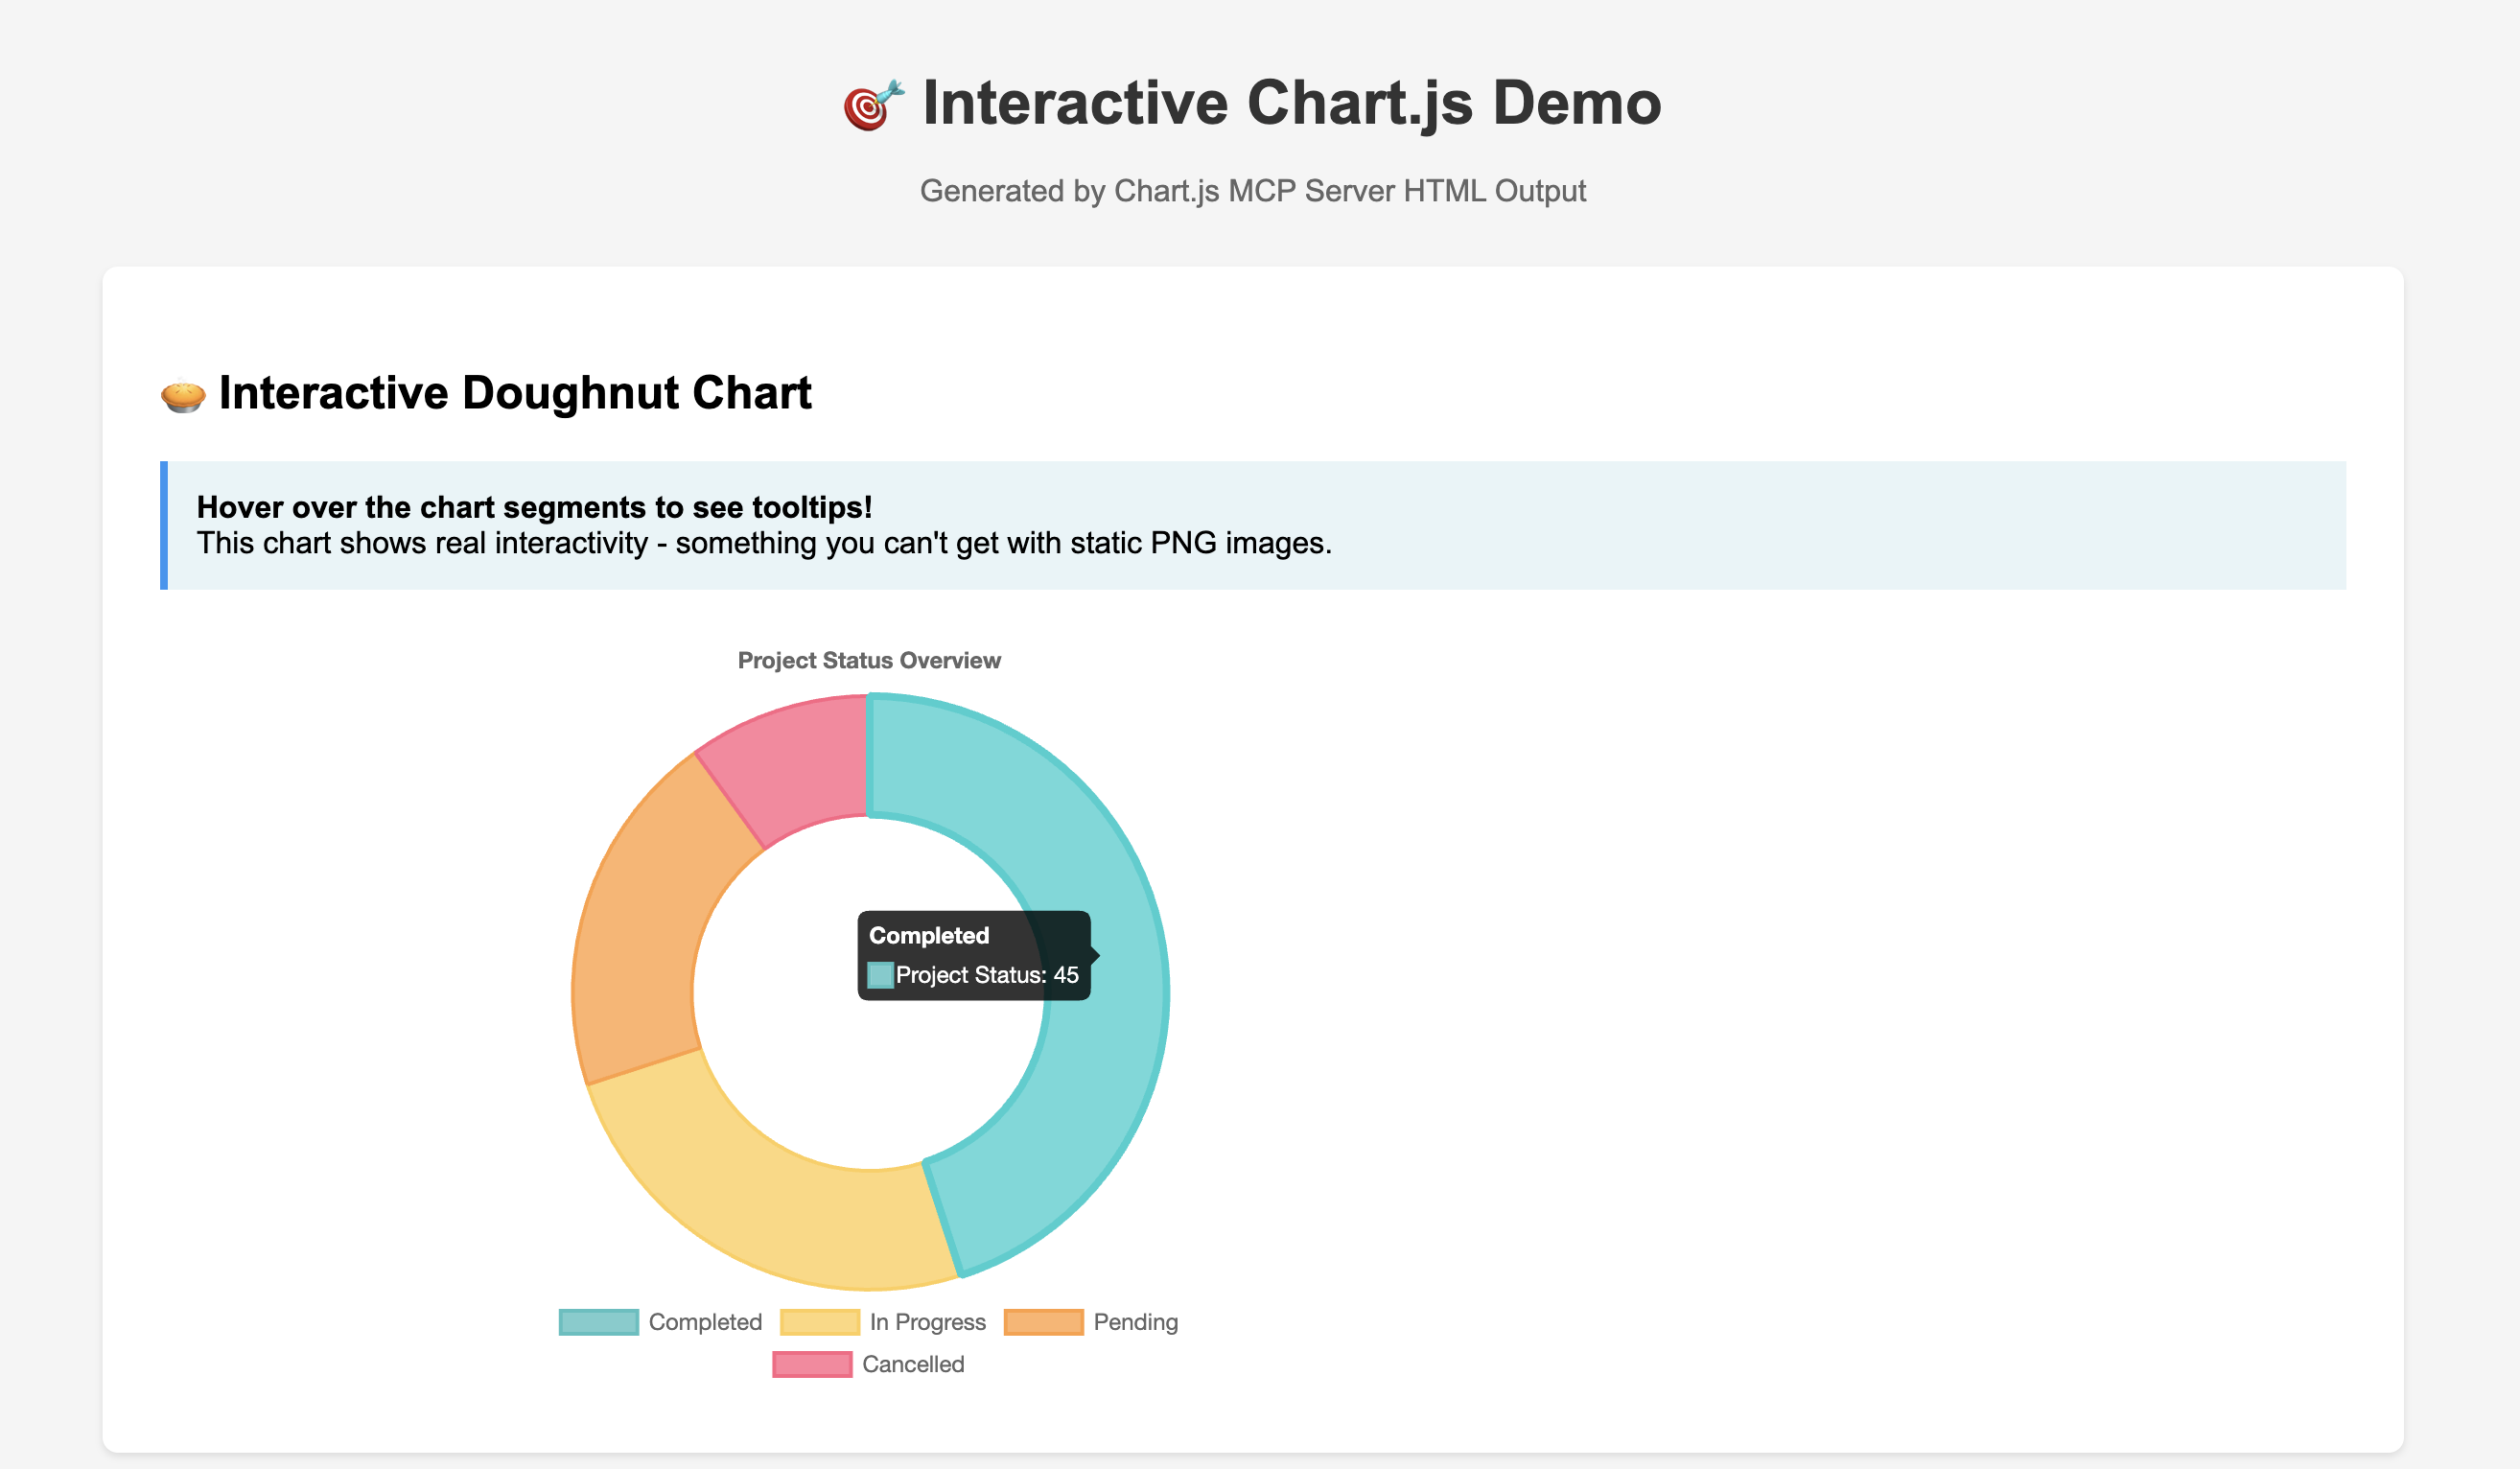 Interactive HTML charts with hover tooltips and animations - perfect for web applications!
🖼️ See It In Action
Here's what you can create with just a simple request:
 Bar Chart Perfect for comparisons |
 Line Chart Great for trends |
 Pie Chart Show proportions |
 Doughnut Chart Modern proportions |
 Radar Chart Multi-dimensional data |
 Scatter Chart Correlation analysis |
 Bubble Chart 3D relationships |
 Polar Area Chart Radial visualizations |
And more chart types coming soon! |
🚀 For Users - Quick Setup
System Requirements
- Node.js 18+ - Required for running the MCP server
Using with Claude Desktop
The simplest way to use this MCP server:
Configure Claude Desktop
Add this to your Claude Desktop configuration file:
macOS:
~/Library/Application Support/Claude/claude_desktop_config.jsonWindows:%APPDATA%/Claude/claude_desktop_config.json{ "mcpServers": { "chartjs": { "command": "npx", "args": ["@ax-crew/chartjs-mcp-server"] } } }Restart Claude Desktop
Start Creating Charts!
Try asking Claude:
"Create a bar chart showing sales data: Q1: $50k, Q2: $75k, Q3: $60k, Q4: $90k"
Using with Cursor
Add to your Cursor settings or workspace configuration:
{
  "mcpServers": {
    "chartjs": {
      "command": "npx",
      "args": ["@ax-crew/chartjs-mcp-server"]
    }
  }
}
Alternative: Install from Source
If you prefer to install from source or want to contribute:
Clone and Build
git clone https://github.com/ax-crew/chartjs-mcp-server.git
cd chartjs-mcp-server
npm install && npm run build
Configure with Local Path
{
  "mcpServers": {
    "chartjs": {
      "command": "node",
      "args": ["/full/path/to/chartjs-mcp-server/dist/index.js"]
    }
  }
}
📖 How to Use
Basic Usage
Once configured, you can ask your AI assistant to create charts using natural language:
- "Create a pie chart of my budget: Housing 40%, Food 25%, Transport 15%, Entertainment 20%"
- "Make a line chart showing website visitors over 6 months: Jan 1000, Feb 1200, Mar 1500, Apr 1300, May 1800, Jun 2100"
- "Generate a bar chart comparing programming languages: JavaScript 65%, Python 45%, Java 35%, Go 25%"
Output Formats
You can specify the output format when creating charts:
PNG Images (Default)
"Create a bar chart as a PNG image showing sales data..."
- High-quality static images (800x600px)
- Perfect for documents, presentations, and sharing
- Works everywhere
Interactive HTML
"Create an interactive HTML doughnut chart showing project status..."
- Self-contained HTML divs with embedded Chart.js
- Hover tooltips and animations
- Perfect for web applications and frontends
- Just inject the HTML into any webpage
JSON Config (New in 3.2.0)
"Create a bar chart as JSON showing quarterly revenue..."
- Returns the raw Chart.js configuration object as JSON
- Ideal for client-side rendering in React/Next.js apps
- Works with AI chat UIs like assistant-ui via
makeAssistantToolUI - See examples/assistant-ui-integration.example.tsx for a full example
Example Interactive HTML Usage:
// The AI returns HTML like this:
const chartHtml = `<div id="chart-container-123">...</div>`;

// You can inject it anywhere:
document.getElementById('dashboard').innerHTML = chartHtml;

// Works with any framework
// React: <div dangerouslySetInnerHTML={{ __html: chartHtml }} />
// Vue: <div v-html="chartHtml"></div>
// Angular: <div [innerHTML]="chartHtml"></div>
Chart Types Available
| Chart Type | Best For | Example Use Case |
|---|---|---|
| Bar | Comparing categories | Sales by region, survey results |
| Line | Trends over time | Stock prices, website traffic |
| Pie | Parts of a whole | Budget breakdown, market share |
| Doughnut | Proportions with focus | Same as pie, but more modern look |
| Scatter | Correlation analysis | Height vs weight, sales vs advertising |
| Bubble | 3D relationships | Revenue vs profit vs company size |
| Radar | Multi-factor comparison | Skill assessments, product features |
| Polar Area | Radial data | Seasonal data, directional analysis |
Advanced Features
- 🎨 Custom Colors: Specify color schemes for your brand
- 📊 Multiple Datasets: Compare multiple data series
- 🏷️ Labels & Titles: Add context with custom labels
- 📱 Responsive: Charts work great at any size
- 🎛️ Chart.js Options: Full access to Chart.js v4 features
- 🖱️ Interactive Elements: Tooltips, hover effects, and animations (HTML format)
- 🔗 Framework Agnostic: HTML output works with React, Vue, Angular, and vanilla JS
🛠️ Troubleshooting
Common Issues
Chart not generating?
- Check that the MCP server is properly configured in your client
- Verify the server is running:
ps aux | grep chartjs - Try restarting your MCP client (Claude Desktop, Cursor, etc.)
Configuration not working?
- Check JSON syntax in your config file
- Ensure file paths are correct
- Check file permissions
Charts look wrong?
- Verify your data format matches Chart.js requirements
- Check for missing required fields (labels, datasets, etc.)
- Try a simpler chart first to test the connection
Getting Help
- Check the examples - See working chart configurations
- Run tests -
npm testto verify everything works - Check logs - Look for error messages in your MCP client
- Open an issue - We're here to help!
🔧 For Developers - Contributing
Want to improve this MCP server? We welcome contributions!
Development Setup
# Clone and setup
git clone https://github.com/ax-crew/chartjs-mcp-server.git
cd chartjs-mcp-server
npm install

# Development workflow
npm run dev          # Watch mode for development
npm test            # Run tests
npm run build       # Build for production
npm run test:watch  # Test in watch mode
Project Structure
chartjs-mcp-server/
├── src/
│   ├── index.ts           # Main MCP server implementation
│   └── chart-schema.json  # Chart.js v4 validation schema
├── examples/              # Example configurations & outputs
│   ├── *.json            # Chart configuration examples
│   ├── *.png             # Generated chart images
│   └── README.md         # Developer examples guide
├── test/
│   └── chart-server.test.js # Comprehensive test suite
├── package.json          # Dependencies and scripts
└── tsconfig.json         # TypeScript configuration
Key Technologies
- TypeScript - Type-safe development
- Chart.js v4 - Chart generation engine
- Node Canvas - Server-side rendering
- MCP Protocol - Model Context Protocol implementation
- Node.js Test Runner - Native testing (no external deps)
Testing
We have comprehensive testing to ensure reliability:
npm test                  # 27 tests across 10 suites
npm run test:integration  # CLI-based integration tests
npm run test:watch        # Development watch mode
Adding New Features
- Add chart type support in
src/index.ts - Create example configuration in
examples/ - Add tests in
test/chart-server.test.js - Update documentation in both READMEs
- Submit a pull request
Code Standards
- ✅ TypeScript with strict mode
- ✅ Comprehensive error handling
- ✅ Test coverage for all features
- ✅ Clear, documented code
- ✅ MCP protocol compliance
📋 API Reference
MCP Tool: generateChart
The server exposes one primary tool for chart generation:
Parameters:
chartConfig(object) - Complete Chart.js v4 configurationoutputFormat(string, optional) - Output format:'png'(default),'html', or'json'saveToFile(boolean, optional) - Save PNG to file (only applies to PNG format)
Returns:
- PNG Success:
{ success: true, buffer: Buffer, message: string }or{ success: true, pngFilePath: string, message: string } - HTML Success:
{ success: true, htmlSnippet: string, message: string } - JSON Success:
{ success: true, jsonConfig: object, message: string } - Error:
{ success: false, error: string, message: string }
Example:
{
  "type": "bar",
  "data": {
    "labels": ["Q1", "Q2", "Q3", "Q4"],
    "datasets": [{
      "label": "Sales",
      "data": [50000, 75000, 60000, 90000],
      "backgroundColor": "rgba(54, 162, 235, 0.8)"
    }]
  },
  "options": {
    "responsive": true,
    "plugins": {
      "title": {
        "display": true,
        "text": "Quarterly Sales"
      }
    }
  }
}
📦 What's Included
- ✅ Complete MCP Server - Ready to use with any MCP client
- ✅ 8 Chart Types - All major Chart.js chart types supported
- ✅ Three Output Formats - PNG images, interactive HTML divs, and JSON config
- ✅ Example Configurations - 8 working examples in
/examples - ✅ Visual References - Generated PNG samples for each chart type
- ✅ Comprehensive Tests - 27 tests ensuring reliability
- ✅ TypeScript Support - Full type safety and IDE support
- ✅ Error Handling - Graceful error handling and validation
- ✅ Documentation - Complete setup and usage guides
🔗 Resources
- 📚 Chart.js Documentation
- 🔌 Model Context Protocol
- 🎨 Example Charts - See all supported chart types
- 📝 Changelog - Version history and release notes
- 🐛 Issue Tracker
- 💬 Discussions
📄 License
MIT License - feel free to use this in your projects!
🌟 Star This Repo!
If this MCP server helps you create amazing charts, please give it a star ⭐ to help others discover it!
Made with ❤️ for the MCP community
Installing Chartjs
This server has no published package — it is built from source. Open the repository and follow its README.
▸ github.com/ax-crew/chartjs-mcp-serverFAQ
Is Chartjs MCP free?
Yes, Chartjs MCP is free — one-click install via Unyly at no cost.
Does Chartjs need an API key?
No, Chartjs runs without API keys or environment variables.
Is Chartjs hosted or self-hosted?
Self-hosted: the server runs locally on your machine via the install command above.
How do I install Chartjs in Claude Desktop, Claude Code or Cursor?
Open Chartjs on unyly.org, pick your client tab (Claude Desktop, Claude Code, Cursor) and press Install — the config is generated automatically, no JSON editing.
Related MCPs
GitHub
PRs, issues, code search, CI status
 by GitHub
Filesystem
Secure file operations with configurable access controls.
Memory
Knowledge graph-based persistent memory system.
Template MCP Server
A CLI tool to create a new Model Context Protocol server project with TypeScript support, dual transport options, and an extensible structure
 by mcpdotdirect
Compare Chartjs with
Not sure what to pick?
Find your stack in 60 seconds
Author?
Embed badge for your README
Browse similar
All development MCPs