
JDI Debugger
FreeNot checkedConnects to running Java applications via JDWP for real-time debugging with breakpoint management, variable inspection, step execution control, and stack trace

About
Connects to running Java applications via JDWP for real-time debugging with breakpoint management, variable inspection, step execution control, and stack trace analysis.
README
JDB-MCP is a Model Context Protocol (MCP) server based on the Java Debug Interface (JDI). It enables AI agents (such as Claude, Cline, Trae) to perform deep runtime debugging of Java applications.
Demo
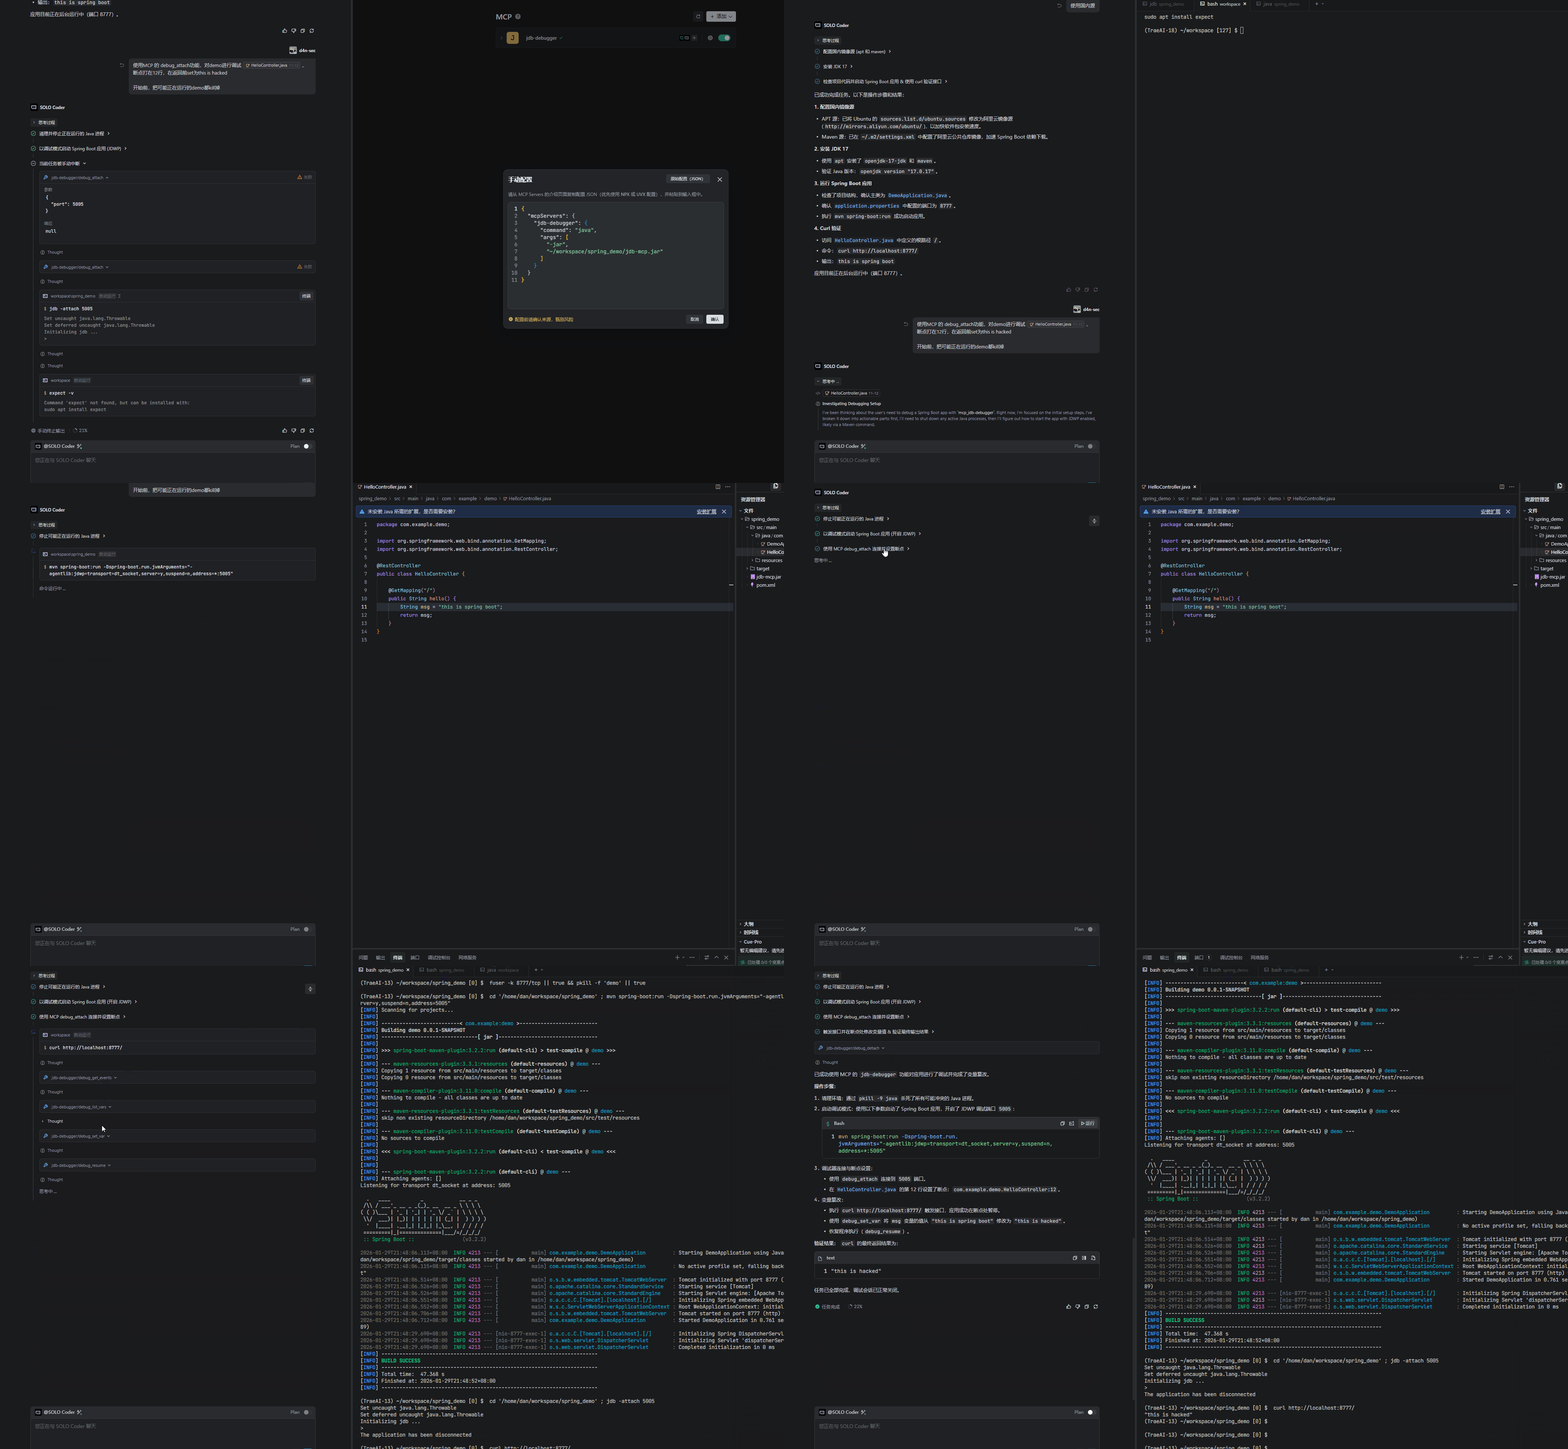
Key Capabilities
- Multi-transport Support: Supports both
stdio(standard VSCode integration) andhttp(for remote/curl debugging). - Full-featured Debugging (Attach Mode Only):
- Attach to running processes (
debug_attach) - Supports any Java application (SpringBoot, Maven, Gradle, etc.) with JDWP enabled. - Breakpoint management (
debug_set_breakpoint,debug_set_watchpoint) - Flow control (Step Over, Step Into, Step Out, Resume)
- State inspection (Stack trace inspection, deep structured variable traversal)
- Thread & Class inspection (
debug_list_threads,debug_list_classes) - Dynamic modification (Change variable values at runtime)
- Attach to running processes (
- Simplified Design: Currently focused on single-session debugging, eliminating the need for complex
sessionIdmanagement. - Manual Debug Mode Required: The target Java application must be started manually with JDWP options enabled.
- Real-time Awareness: Leveraging MCP Notifications, AI agents are immediately notified when a breakpoint is hit.
Installation & Build
Prerequisites
- JDK 17+ (with JDI module)
Build fatJAR
# Build all modules and generate JARs in the `release/` directory
mvn clean package

# Or build for a specific JDK version:

# For JDK 17+ (Recommended)
mvn clean package -pl jdb-mcp-jdk17 -am

# For JDK 7 (Legacy Support)
mvn clean package -pl jdb-mcp-jdk7 -am
The executable JARs will be located in the release/ directory:
release/jdb-mcp.jar(JDK 17+)release/jdb-mcp-jdk7.jar(JDK 7)
Configuration & Usage
Startup Options
--transport <stdio|http>: Set transport mode (default:stdio).--notifications <true|false>: Enable real-time AI notifications (default:true).
For detailed tool parameter analysis, please refer to the Parameter Guide.
Usage in VSCode (Cline/Claude Dev)
Add the following configuration to your MCP settings:
{
  "mcpServers": {
    "jdb-debugger": {
      "command": "java",
      "args": [
        "-jar",
        "path/to/jdb-mcp.jar"
      ]
    }
  }
}
How to Debug (Attach Mode)
Important: You must manually start your target Java application with JDWP enabled.
- Start your project:
java -agentlib:jdwp=transport=dt_socket,server=y,suspend=n,address=*:5005 -jar your-app.jar - In the AI chat, request:
Attach to localhost:5005 and debug...
Tool List
debug_attach: Attach to an existing debug port via Socket.debug_list_threads: List all threads and their status.debug_list_classes: List loaded classes with optional filtering.debug_list_methods: List methods in a specific class.debug_source: Retrieve source code for a class (requires source roots).debug_set_method_breakpoint: Set a breakpoint at method entry.debug_set_method_entry: Monitor method entry events.debug_set_method_exit: Monitor method exit events.debug_list_vars: List variables (supportsthreadName,frameIndexandscopefilter).debug_get_var: Get detailed info for a specific variable.debug_set_var: Modify runtime variables (supportsthreadNameandframeIndex).- ...and more (see
tools/list).
TODO List
- Implement
debug_launch: Enable "out-of-the-box" experience by allowing users to launch and debug Java programs directly through the MCP. - Implement
debug_calc: Support evaluating arbitrary Java expressions in the debug context (Expression Evaluation). - Multi-session Support: Refactor to allow one MCP instance to manage and debug multiple target programs simultaneously.
- Package Prefix Filtering: Support filtering by package prefix (e.g.,
com.example.*) for method entry/exit and breakpoints. - Batch Class Filtering: Support passing multiple class names or wildcard patterns at once for filtering events.
- Enhanced Breakpoint Control: Support conditional breakpoints and thread filtering for more precise debug interruption.
- To be added: More features based on community feedback.
License
Open-sourced under the MIT License.
Installing JDI Debugger
This server has no published package — it is built from source. Open the repository and follow its README.
▸ github.com/d4n-sec/jdb-mcpFAQ
Is JDI Debugger MCP free?
Yes, JDI Debugger MCP is free — one-click install via Unyly at no cost.
Does JDI Debugger need an API key?
No, JDI Debugger runs without API keys or environment variables.
Is JDI Debugger hosted or self-hosted?
Self-hosted: the server runs locally on your machine via the install command above.
How do I install JDI Debugger in Claude Desktop, Claude Code or Cursor?
Open JDI Debugger on unyly.org, pick your client tab (Claude Desktop, Claude Code, Cursor) and press Install — the config is generated automatically, no JSON editing.
Related MCPs
GitHub
PRs, issues, code search, CI status
 by GitHub
Filesystem
Secure file operations with configurable access controls.
Memory
Knowledge graph-based persistent memory system.
Template MCP Server
A CLI tool to create a new Model Context Protocol server project with TypeScript support, dual transport options, and an extensible structure
 by mcpdotdirect
Compare JDI Debugger with
Not sure what to pick?
Find your stack in 60 seconds
Author?
Embed badge for your README
Browse similar
All development MCPs