
Scherlok
FreeNot checkedZero-config data quality monitoring as MCP tools. Profiles a warehouse (Postgres, BigQuery, Snowflake, MySQL, DuckDB), detects anomalies, and gates CI — read-on

About
Zero-config data quality monitoring as MCP tools. Profiles a warehouse (Postgres, BigQuery, Snowflake, MySQL, DuckDB), detects anomalies, and gates CI — read-only with the connection resolved server-side, never via the model.
README





Scherlok
Your data broke in production. Again.
Scherlok makes sure it doesn't happen next time.

Zero config. Zero YAML. Zero rules to write.
Scherlok learns what "normal" looks like, then tells you when something changes.
The Problem
Every data team has the same nightmare:
A source API silently changes from dollars to cents. Revenue dashboards show wrong numbers for 3 weeks before anyone notices.
A column starts returning NULLs. A table stops updating. Row counts drop 40% on a Tuesday. Nobody knows until the CEO asks why the report looks weird.
Current tools (Great Expectations, Soda, dbt tests) require you to define what "correct" looks like before you can detect what's wrong. Hundreds of rules. Dozens of YAML files. And you still miss things — because you can't write rules for problems you haven't imagined yet.
The Solution
Scherlok takes the opposite approach: learn first, then detect.
scherlok connect postgres://user:pass@host/db   # connect once
scherlok investigate                              # learn your data
scherlok watch                                    # detect anomalies
Three commands. Five minutes. Done.
What It Catches
| Anomaly | What Happened | Severity |
|---|---|---|
| Volume drop | Row count dropped 40% overnight | CRITICAL |
| Volume spike | 3x more rows than normal | WARNING |
| Freshness alert | Table hasn't updated in 12h (normally every 2h) | CRITICAL |
| Schema drift | Column removed or type changed | CRITICAL |
| NULL surge | NULL rate jumped from 2% to 45% | WARNING |
| Distribution shift | Column mean shifted 3+ standard deviations (Shewhart-style control limit) | INFO, WARNING above 5σ |
| Cardinality explosion | Status column went from 5 values to 500 | CRITICAL |
Every anomaly is auto-scored: INFO, WARNING, or CRITICAL. No thresholds to configure.
Works with dbt
Already running dbt? Scherlok complements dbt test with automatic anomaly detection — no rules to write.
pip install scherlok[dbt]

# After `dbt run`, point Scherlok at your project
scherlok dbt --project-dir ./my_dbt_project
Scherlok reads target/manifest.json, discovers every materialized model (table, incremental, view), auto-resolves the connection from your profiles.yml, and profiles each model:
Investigating 4 dbt models in ./my_dbt_project (postgres)
  ✓ stg_customers                  (12,345 rows)
  ✓ stg_orders                     (98,765 rows)
  ✗ fct_orders                     CRITICAL: Row count dropped 42% (98,765 → 57,283)
  ✓ dim_customers_inc              (12,300 rows)

Summary: 4 profiled, 1 anomalies (1 critical, 0 warning)
Use it as a CI gate after dbt run:
- run: dbt run --target prod
- run: scherlok dbt --project-dir . --target prod --fail-on critical
Or collapse both steps into one with the wrapper:
- run: scherlok dbt-run-and-watch --project-dir . --target prod --fail-on critical
Supported adapters: postgres, bigquery, snowflake, mysql, duckdb. For others, pass --connection-string explicitly.
📖 Full docs: dbt integration guide →
HTML dashboard
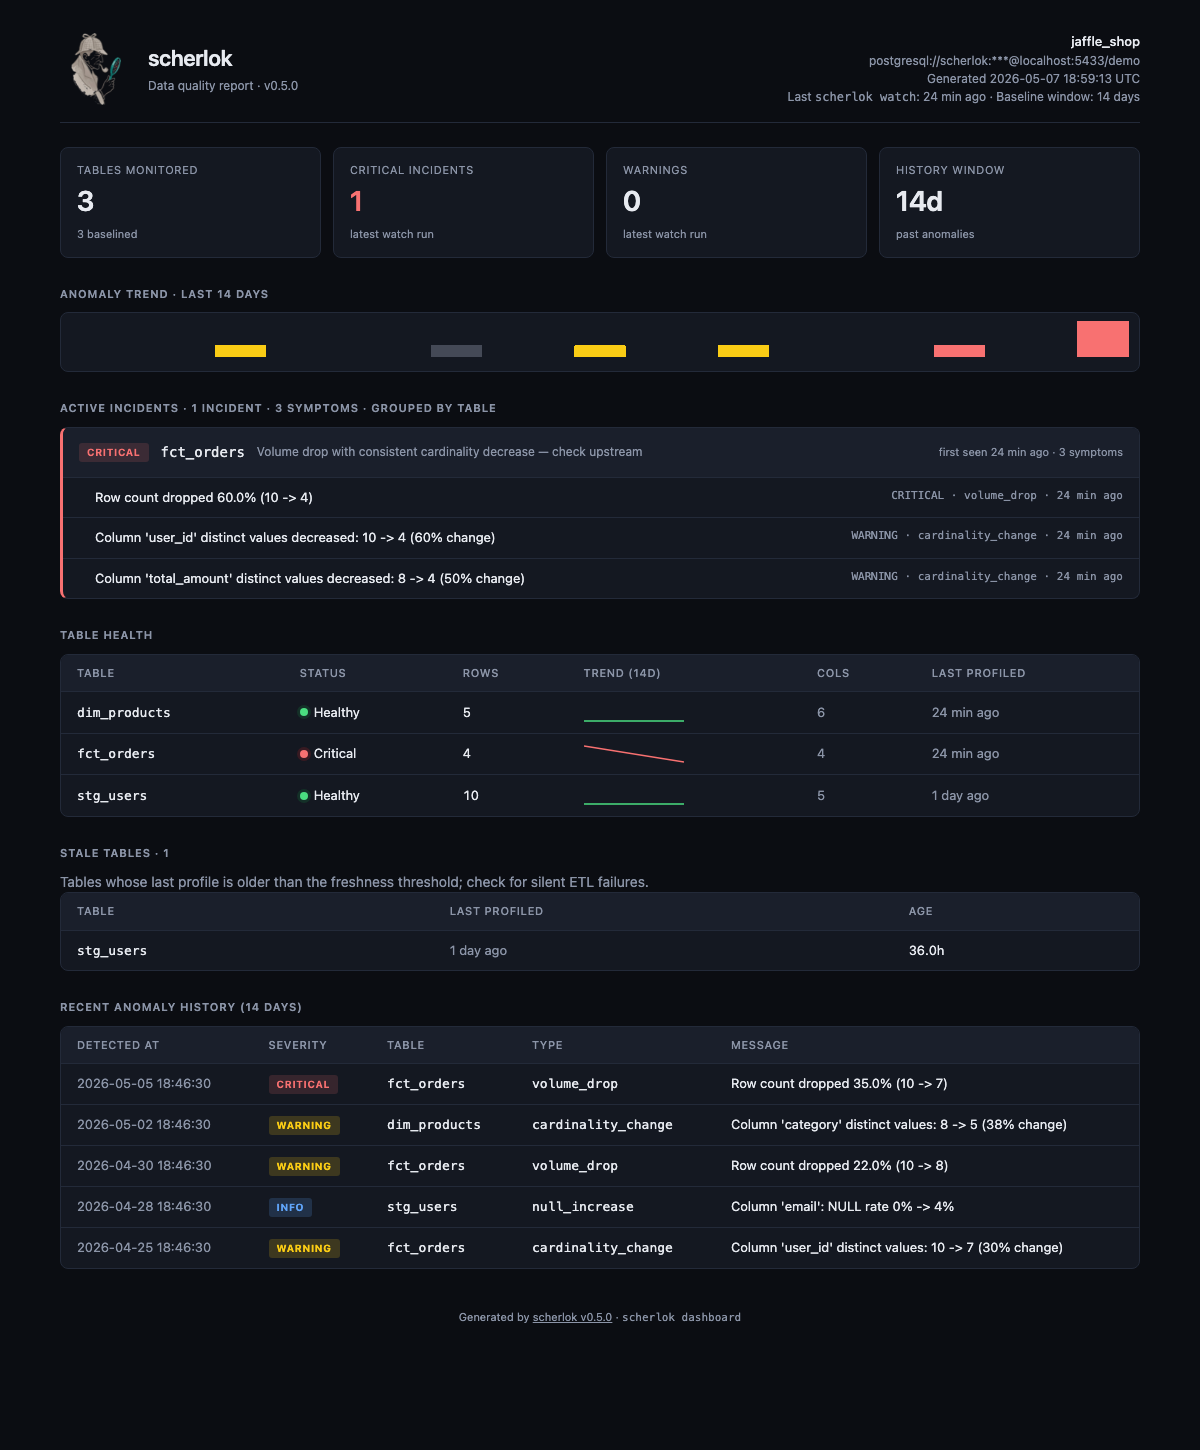
scherlok dashboard --out report.html
One self-contained HTML file (~28 KB): KPIs, per-table incidents grouped with first-seen timestamps, +/−/~ schema-drift diff, sparklines, and full anomaly history. Auto dark/light theme via prefers-color-scheme.
📖 Full docs: dashboard guide →
Use it from an AI agent (MCP)
Let Claude Code / Claude Desktop run data-quality checks directly:
pip install scherlok # scherlok-mcp ships built-in since v0.7.0
{
  "mcpServers": {
    "scherlok": {
      "command": "scherlok-mcp",
      "env": { "SCHERLOK_CONNECTION": "postgresql://user:pass@host/db" }
    }
  }
}
The agent gets list_tables, investigate, watch, status, history, and check as tools. Credentials are resolved server-side (never passed by the model), every operation is read-only on the warehouse, and there's no arbitrary-SQL tool.
📖 Full docs: MCP server guide →
AI-explained alerts (--explain)
Your alert says what broke. --explain adds why — and what to check next.
pip install 'scherlok[explain]'
export ANTHROPIC_API_KEY=sk-ant-...

scherlok watch --webhook https://hooks.slack.com/... --explain
When anomalies fire, Scherlok makes one Claude call for the whole batch and injects a short root-cause hypothesis into the same Slack/Discord/Teams/email/JSON alert:

Works on watch, ci, check, dbt, and dbt-run-and-watch. On dbt projects the hypothesis is lineage-aware: upstream parents from manifest.json go into the prompt, so cascading failures get traced to the source model instead of alerting on every downstream symptom.
- What it costs — one call per fired run (not per anomaly), Claude Haiku 4.5 by default: well under a cent per run (~$0.003). Override the model with
SCHERLOK_EXPLAIN_MODEL. Runs with zero anomalies make no API call. - What it sends — aggregates only: the anomaly type/severity/message strings already in your alert, dbt model names, detection timestamps. Never warehouse rows, cell values, or credentials — the test suite pins this as a contract.
- How to turn it off — it's opt-in; don't pass
--explain. If the API call fails (no key, timeout, rate limit), the original alert is delivered unchanged with a one-line note. Alerting never blocks on the LLM.
📖 Full docs: explainer guide →
How It Works
1. investigate — Learn the patterns
$ scherlok investigate

  Profiling 12 tables...
  ✓ users         — 45,231 rows, 8 columns
  ✓ orders        — 1,203,847 rows, 15 columns
  ✓ products      — 892 rows, 12 columns
  ...
  Done. Profiles saved.
Scherlok profiles every table: row counts, column types, NULL rates, value distributions, freshness cadence, cardinality. Stores everything locally in SQLite.
2. watch — Detect anomalies
$ scherlok watch

  Checking 12 tables against learned profiles...

  🔴 CRITICAL  orders    volume_drop     Row count dropped 52% (1,203,847 → 578,412)
  🟡 WARNING   users     null_increase   Column "email": NULL rate 2.1% → 18.7%
  🔵 INFO      products  distribution    Column "price": mean shifted 3.2σ

  3 anomalies detected. Exit code: 1
3. Alert — Slack, CI/CD, or both
# Slack
scherlok watch --webhook https://hooks.slack.com/services/...

# Discord
scherlok watch --webhook https://discord.com/api/webhooks/...

# Microsoft Teams
scherlok watch --webhook https://outlook.office.com/webhook/...

# Any endpoint (generic JSON payload)
scherlok watch --webhook https://my-api.com/alerts

# CI/CD gate (fails pipeline on CRITICAL)
scherlok watch --exit-code --fail-on critical
Auto-detects Slack, Discord, and Teams from the URL and formats the payload accordingly. Any other URL receives a generic JSON payload.
CI/CD Integration
Use Scherlok as a data quality gate. The ci command does it in one line:
# GitHub Actions
- name: Data quality check
  run: |
    pip install scherlok
    scherlok config --store s3://my-bucket/scherlok/profiles.db
    scherlok ci ${{ secrets.DATABASE_URL }} \
      --webhook ${{ secrets.SLACK_WEBHOOK }} \
      --fail-on critical
If Scherlok detects a critical anomaly, the pipeline fails. Bad data never reaches production.
Email alerts
export SCHERLOK_SMTP_HOST=smtp.gmail.com
export [email protected]
export SCHERLOK_SMTP_PASSWORD=app-specific-password

scherlok watch --email [email protected] --email [email protected]
Connectors
# PostgreSQL
scherlok connect postgres://user:pass@host:5432/db

# BigQuery — see src/scherlok/connectors/bigquery.md for auth, billing, CI patterns
pip install scherlok[bigquery]
scherlok connect bigquery://project-id/dataset-name

# Snowflake
pip install scherlok[snowflake]
export SNOWFLAKE_USER=...
export SNOWFLAKE_PASSWORD=...
export SNOWFLAKE_WAREHOUSE=...
scherlok connect snowflake://account/database/schema

# MySQL
pip install scherlok[mysql]
scherlok connect mysql://user:pass@host:3306/dbname

# DuckDB
pip install scherlok[duckdb]
scherlok connect duckdb:///path/to/file.db
| Database | Status |
|---|---|
| PostgreSQL | Available |
| BigQuery | Available |
| Snowflake | Available |
| MySQL | Available |
| DuckDB | Available |
Remote Storage
Share profiles across CI runs and team members:
# AWS S3
scherlok config --store s3://my-bucket/scherlok/profiles.db

# Google Cloud Storage
scherlok config --store gs://my-bucket/scherlok/profiles.db

# Azure Blob Storage
scherlok config --store az://my-container/scherlok/profiles.db
Why Not [Other Tool]?
| Great Expectations | Soda | Monte Carlo | Scherlok | |
|---|---|---|---|---|
| Setup time | Hours | 30 min | Weeks | 5 minutes |
| Config required | Hundreds of rules | YAML checks | Dashboard setup | None |
| Anomaly detection | Manual thresholds | Paid feature | Yes | Yes, free |
| Self-hosted | Yes | Limited | No (SaaS) | Yes |
| CI/CD gate | Yes | Yes | No | Yes |
| Price | Free | Freemium | $50-200K/yr | Free, forever |
CLI Reference
scherlok connect <url>          Connect to a database
scherlok investigate            Profile all tables (learn patterns)
scherlok watch [-w <url>] [-e <email>]  Detect anomalies and alert
scherlok ci <url> [opts]        All-in-one CI/CD command (connect + watch + exit code)
scherlok status                 Quick health dashboard
scherlok report                 Detailed profile summary
scherlok history [--days N]     Timeline of past anomalies
scherlok config --store <url>   Set remote storage
scherlok version                Show version
Install
pip install scherlok

# With BigQuery support
pip install scherlok[bigquery]
Requires Python 3.10+.
Run via Docker
A pre-built image with every warehouse extra (dbt, bigquery, snowflake) is published to GitHub Container Registry on every release tag:
docker run --rm ghcr.io/rbmuller/scherlok:latest version
Mount your project directory and inject connection details the same way your CI does it; the entrypoint is the scherlok CLI:
docker run --rm \
  -v "$PWD:/work" -w /work \
  -e SCHERLOK_CONNECTION=postgres://... \
  ghcr.io/rbmuller/scherlok:latest watch
The image is built from python:3.12-slim and runs unprivileged (USER scherlok).
Contributing
Contributions welcome! See CONTRIBUTING.md.
We're especially looking for:
- New database connectors (Snowflake, MySQL, DuckDB)
- Anomaly detection improvements
- Documentation and examples
License
MIT — Developed by Robson Bayer Müller
Install Scherlok in Claude Desktop, Claude Code & Cursor
unyly install scherlokInstalls into Claude Desktop, Claude Code, Cursor & VS Code — handles npx, uvx and build-from-source repos for you.
First time? Get the CLI: curl -fsSL https://unyly.org/install | sh
Or configure manually
Run in your terminal:
claude mcp add scherlok -- uvx scherlokFAQ
Is Scherlok MCP free?
Yes, Scherlok MCP is free — one-click install via Unyly at no cost.
Does Scherlok need an API key?
No, Scherlok runs without API keys or environment variables.
Is Scherlok hosted or self-hosted?
A hosted option is available: Unyly runs the server in the cloud, no local setup required.
How do I install Scherlok in Claude Desktop, Claude Code or Cursor?
Open Scherlok on unyly.org, pick your client tab (Claude Desktop, Claude Code, Cursor) and press Install — the config is generated automatically, no JSON editing.
Related MCPs
wenb1n-dev/SmartDB_MCP
A universal database MCP server supporting simultaneous connections to multiple databases. It provides tools for database operations, health analysis, SQL optim
 by wenb1n-dev
Postgres Server
This server enables interaction with PostgreSQL databases through the Model Context Protocol, optimized for the AWS Bedrock AgentCore Runtime. It provides tools
 by madhurprash
Postgres
Query your database in natural language
 by Anthropic
PostgreSQL
Read-only database access with schema inspection.
by modelcontextprotocolCompare Scherlok with
Not sure what to pick?
Find your stack in 60 seconds
Author?
Embed badge for your README
Browse similar
All data MCPs