
Stock Intelligence
БесплатноНе проверенProvides interactive stock charts and financial data tools using MCP Apps. Enables natural language queries for stock quotes, charts, financials, earnings, and

Описание
Provides interactive stock charts and financial data tools using MCP Apps. Enables natural language queries for stock quotes, charts, financials, earnings, and market movers with a free FMP API key.
README
Interactive stock charts rendered directly in your AI conversation using MCP Apps.
One charting tool with 7 views. 7 inline data tools. Interactive controls right in the chart.
100% free API key — no paid tier required.



What are MCP Apps? An extension to the Model Context Protocol that lets MCP servers return interactive HTML interfaces — charts, forms, dashboards — rendered directly inside the AI conversation. Announced in the MCP Apps blog post, supported in Claude Desktop, ChatGPT, VS Code, and more. This project uses MCP Apps to render canvas-based financial charts with inline controls that let you adjust parameters without a new AI call.
How It Works
Two modes — visual charts or inline data:
- "Show me" → AI uses
stock_app→ interactive chart with controls appears - "What's the price of" → AI uses
stock_quote→ numbers in text
You: "Show me NVIDIA's stock chart for the last year"

AI calls: stock_app(symbol="NVDA", view="chart", period="1y")

→ Interactive candlestick chart with volume bars and hover crosshair.
  Inline controls: switch between 1M/3M/6M/1Y/2Y/5Y and Candle/Line/Area
  without making a new AI call.
You: "Show me Apple's quarterly financials"

AI calls: stock_app(symbol="AAPL", view="financials")

→ Column chart of revenue, net income, gross profit.
  Inline controls: switch between Income/Balance Sheet/Cash Flow,
  Quarterly/Annual, and Column/Bar/Dual Axes/Table.
You: "What's Tesla's price right now?"

AI calls: stock_quote(symbol="TSLA")

→ Text: "TSLA is trading at $248.50, up +2.3% today.
   Market cap $789B, 52-week range $152–$299."
You: "Is Microsoft undervalued?"

AI calls: stock_app(symbol="MSFT", view="valuation")

→ DCF gauge chart: intrinsic value vs current price, margin of safety.
  Verdict: undervalued/overvalued/fairly valued.
You: "Who's reporting earnings this week?"

AI calls: stock_earnings_calendar(days_ahead=7)

→ Text: "47 earnings reports this week: AAPL (Mon), GOOGL (Tue)..."
Quick Start
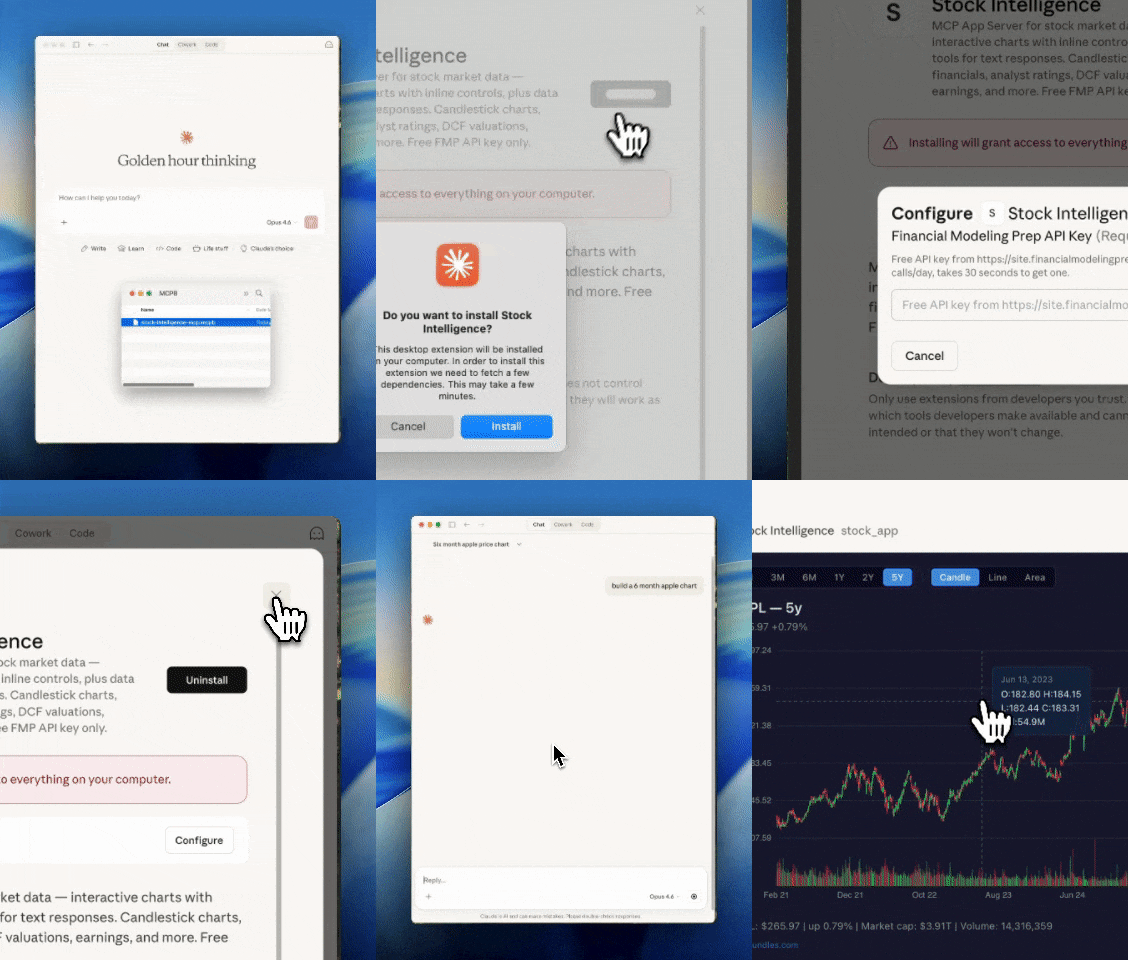
1. Double-click the .mcpb file
Open stock-intelligence-mcp.mcpb — Claude Desktop will prompt you to install it.
2. Add your FMP API key
Get a free key (30 seconds): https://site.financialmodelingprep.com/developer/docs
Free tier: 250 API calls/day — enough for a full day of research. Claude Desktop will ask for it during setup.
3. Start asking
"Show me AAPL's stock chart as a line chart over 2 years"
"What are the latest analyst ratings for NVDA?"
"Show me Apple's balance sheet — annual view"
"Is Tesla undervalued or overvalued right now?"
"What's Amazon's earnings beat/miss record?"
"Who's reporting earnings this week?"
"What's the price of Google right now?"
"Show me today's market movers as a heatmap"
"Compare Apple's quarterly cash flow"
10 Tools
stock_app — Interactive Charting (1 tool, 7 views)
The AI picks the view based on your question. Each chart has inline controls to adjust parameters without a new AI call.
| View | What it shows | Inline controls |
|---|---|---|
chart |
Price history with volume | Period (1M–5Y), Style (Candle/Line/Area) |
quote |
Live quote card with sparkline | — |
financials |
Revenue, income, gross profit | Statement (Income/Balance/Cash Flow), Period (Q/Annual), Style |
earnings |
EPS actual vs estimate, beat/miss | Style (Card/Column/Table) |
analyst |
Rating donut, price targets, grades | Style (Card/Table) |
valuation |
DCF gauge, margin of safety | Style (Card/Table) |
market |
Top gainers/losers/most active | Style (Bar/Heatmap/Table) |
Inline Data Tools (7 tools — text responses)
Use these when you want numbers in text, not a visual chart. Every data tool has a chart equivalent.
| Tool | What it returns | Chart equivalent |
|---|---|---|
stock_quote |
Price, change, volume, market cap, 52-week range | stock_app(view='quote') |
stock_price_history |
Historical daily OHLCV bars | stock_app(view='chart') |
stock_financials |
Income/balance/cashflow statement data | stock_app(view='financials') |
stock_earnings |
EPS history, beat/miss record | stock_app(view='earnings') |
stock_analyst |
Ratings, price targets, grade changes | stock_app(view='analyst') |
stock_valuation |
DCF intrinsic value, margin of safety | stock_app(view='valuation') |
market_overview |
Gainers, losers, most active | stock_app(view='market') |
Utility Tools (2 tools)
| Tool | What it does |
|---|---|
stock_search |
Find stocks by company name or keyword |
stock_earnings_calendar |
Upcoming earnings dates and EPS estimates |
Architecture
stock_app (charting)                    Data tools (inline text)
────────────────────                    ────────────────────────
User asks question                      User asks for numbers
  → AI picks view + params               → AI picks data tool
  → Tool fetches from FMP API            → Tool fetches from FMP API
  → Returns data with chart_type         → Returns structured data
  → MCP App renders interactive chart    → AI formats as text response
  → User adjusts with inline controls
  → Controls re-call stock_app
All charts are rendered with inline canvas — no external JS libraries. The HTML file is self-contained (~55KB) with 19 chart renderers.
Data Source
All data comes from Financial Modeling Prep (FMP) — free tier only:
| What | Free tier? |
|---|---|
| Real-time quotes | Yes — end-of-day data |
| Historical charts | Yes — daily OHLCV |
| Financial statements | Yes — income, balance sheet, cash flow |
| Analyst data | Yes — ratings, price targets, grades |
| DCF valuations | Yes — discounted cash flow models |
| Market movers | Yes — gainers, losers, most active |
| Earnings calendar | Yes — upcoming earnings dates |
Free tier: 250 API calls/day. One API key, takes 30 seconds to get one.
Rebuild the .mcpb
./build-mcpb.sh
Outputs a fresh stock-intelligence-mcp.mcpb. Double-click to reinstall.
Alternative: Run from source
pip install -e .

export FMP_API_KEY=your_key_here

stock-intelligence-mcp
Then add to your Claude Desktop config (~/.claude/claude_desktop_config.json):
{
  "mcpServers": {
    "stock-intelligence": {
      "command": "stock-intelligence-mcp",
      "env": {
        "FMP_API_KEY": "your_key_here"
      }
    }
  }
}
Hosted Version
Don't want to manage API keys or run locally?
mcpbundles.com — same tools, zero setup, 200+ FMP tools always available.
Contributing
PRs welcome — new chart types, data visualizations, UI improvements.
git clone https://github.com/thinkchainai/stock-intelligence-mcp.git
cd stock-intelligence-mcp
pip install -e .
License
MIT — see LICENSE.
Built by MCPBundles.
Установка Stock Intelligence
У этого сервера нет опубликованного пакета — он собирается из исходников. Открой репозиторий и следуй инструкции в README.
▸ github.com/thinkchainai/stock-intelligence-mcpFAQ
Stock Intelligence MCP бесплатный?
Да, Stock Intelligence MCP бесплатный — установка в пару кликов через Unyly без оплаты.
Нужен ли API-ключ для Stock Intelligence?
Нет, Stock Intelligence работает без API-ключей и переменных окружения.
Stock Intelligence — hosted или self-hosted?
Self-hosted: сервер запускается локально на твоей машине командой из раздела установки.
Как установить Stock Intelligence в Claude Desktop, Claude Code или Cursor?
Открой Stock Intelligence на unyly.org, выбери вкладку своего клиента (Claude Desktop, Claude Code, Cursor) и нажми Install — конфиг сгенерируется автоматически, без правки JSON.
Похожие MCP
GitHub
PRs, issues, code search, CI status
 автор: GitHub
Filesystem
Secure file operations with configurable access controls.
Memory
Knowledge graph-based persistent memory system.
Template MCP Server
A CLI tool to create a new Model Context Protocol server project with TypeScript support, dual transport options, and an extensible structure
 автор: mcpdotdirect
Compare Stock Intelligence with
Не уверен что выбрать?
Найди свой стек за 60 секунд
Автор?
Embed-бейдж для README
Похожее
Все в категории development