
Webmcpinspector
FreeNot checkedWebMCP Inspector discovers both declarative (HTML form-based) and imperative (JavaScript API) tools exposed via the WebMCP specification. It lets you view schem

About
WebMCP Inspector discovers both declarative (HTML form-based) and imperative (JavaScript API) tools exposed via the WebMCP specification. It lets you view schemas, edit attributes, execute tools, and test with Chrome's on-device Gemini Nano model, all through a live sandboxed browser session powered by Webfuse.
README
Inspect, debug, and augment WebMCP tools on any webpage — in real time.
WebMCP Inspector discovers both declarative (HTML form-based) and imperative (JavaScript API) tools exposed via the WebMCP specification. It lets you view schemas, edit attributes, execute tools, and test with Chrome's on-device Gemini Nano model, all through a live sandboxed browser session powered by Webfuse.
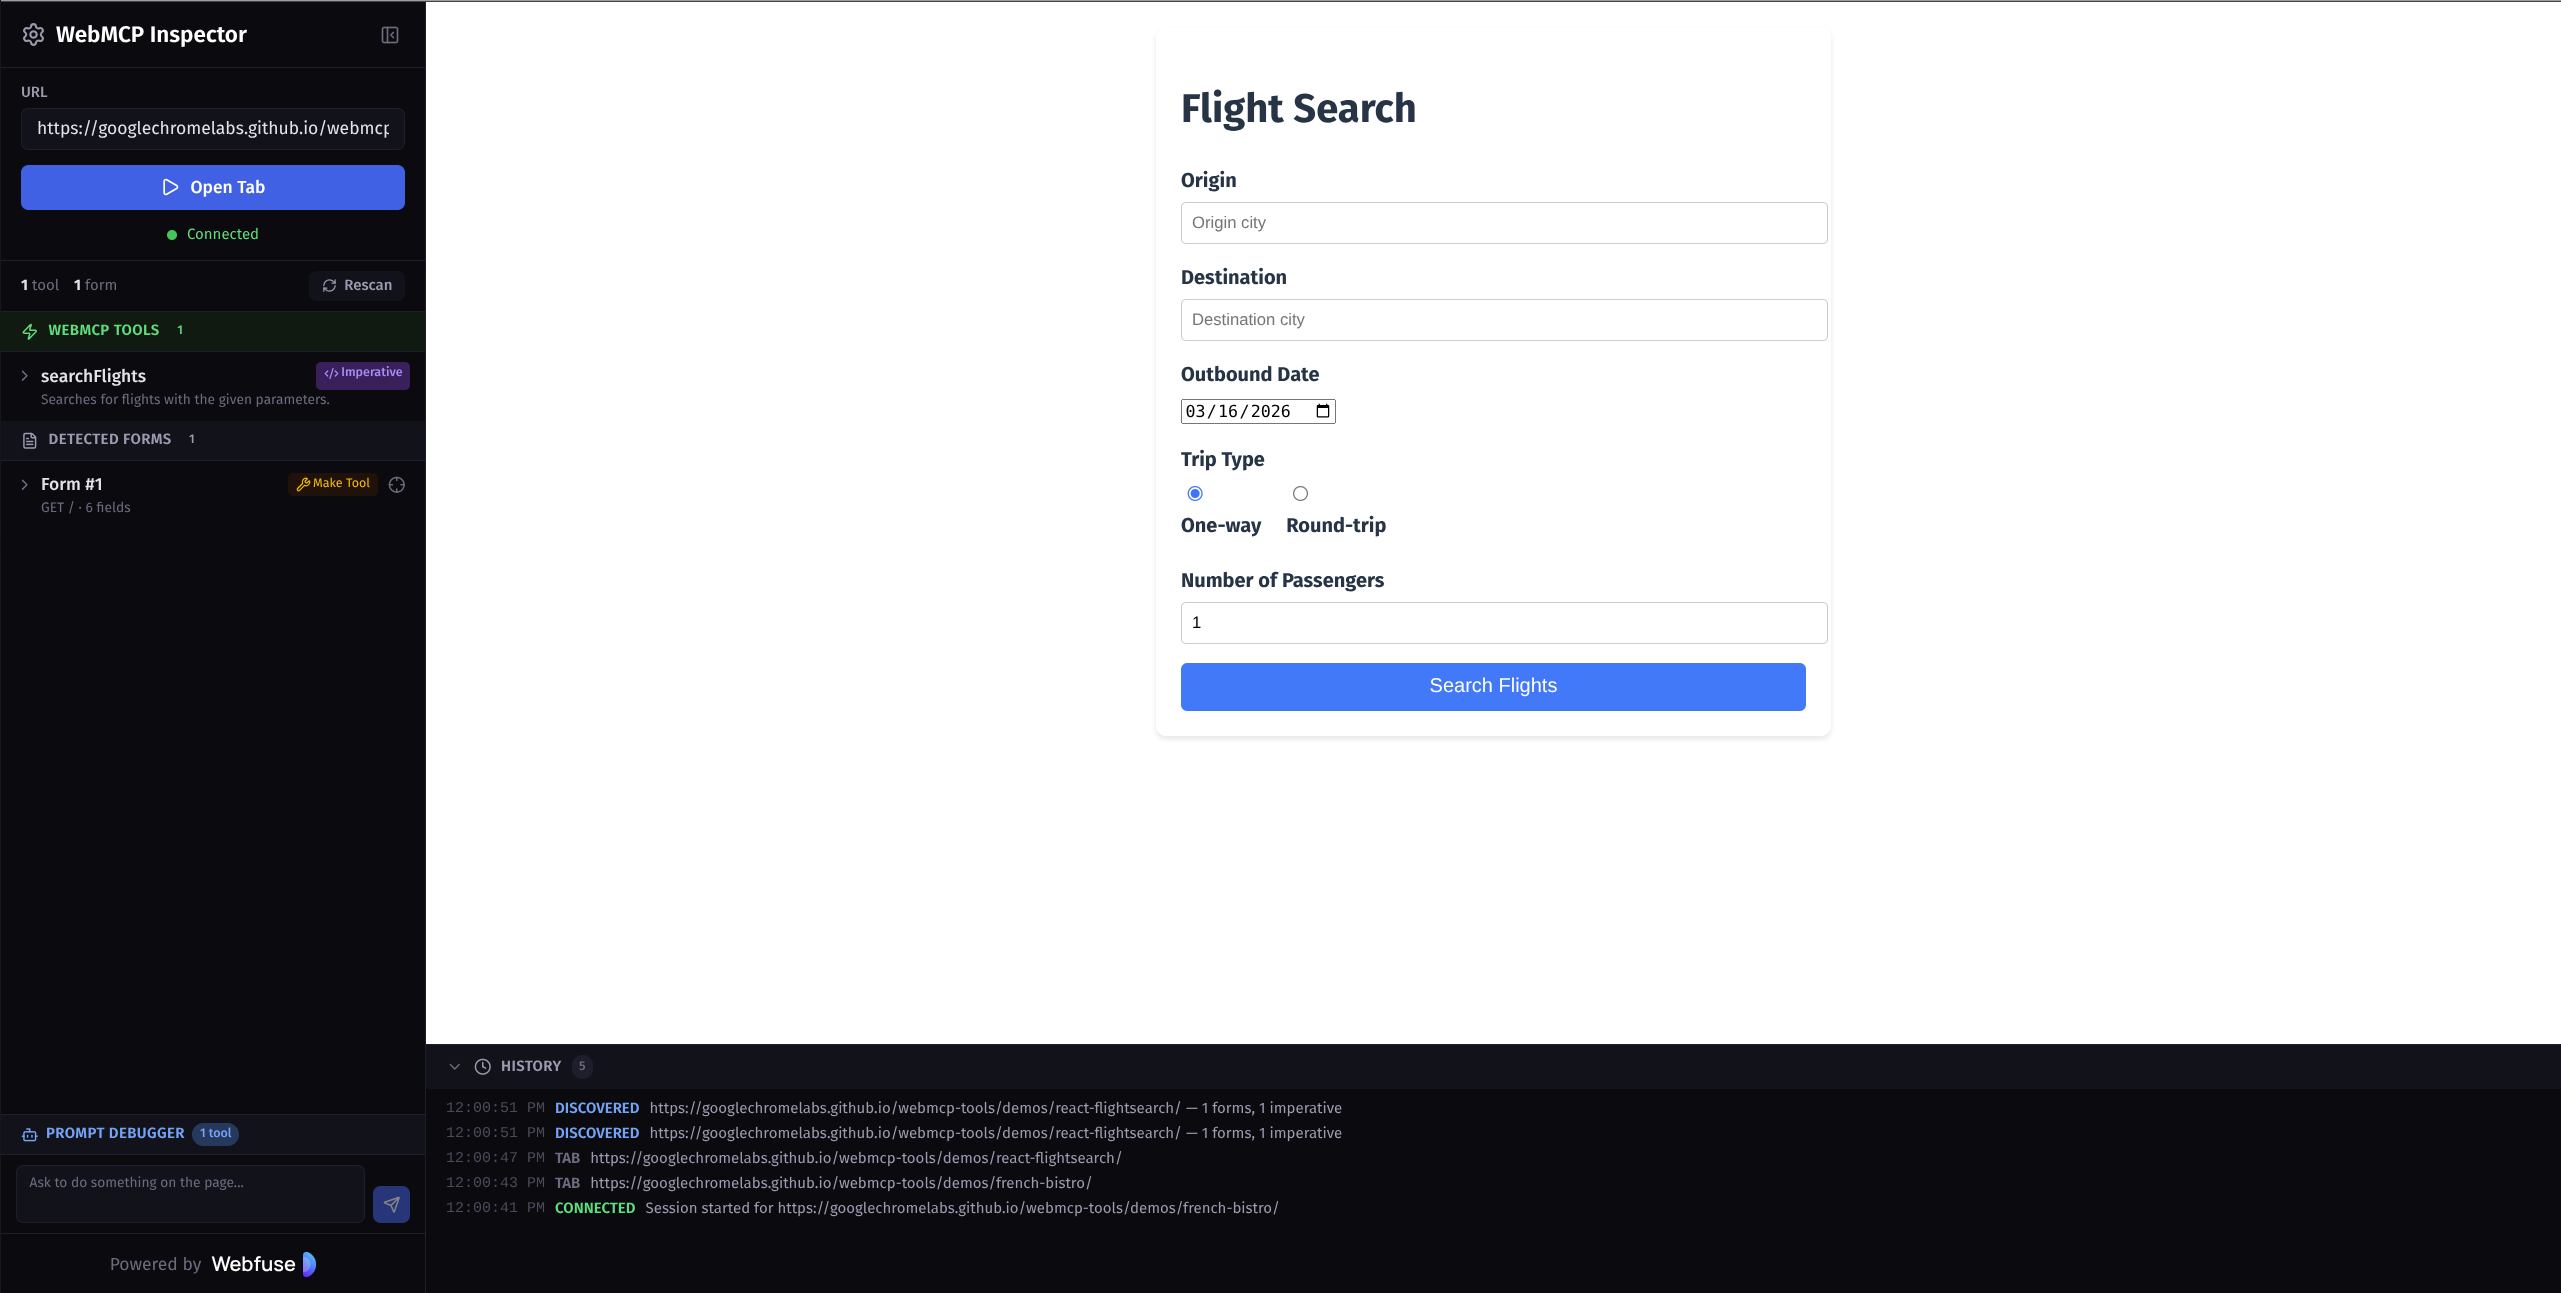
Live Demo
Features
Tool Discovery
- Declarative tools — Scans pages for HTML forms annotated with WebMCP attributes (
toolname,tooldescription,toolparamtitle,toolparamdescription,toolautosubmit) - Imperative tools — Detects tools registered via
navigator.modelContext.registerTool()with full input schema support (requires Chrome 146+) - Form augmentation — Turn any plain HTML form into a WebMCP tool by adding metadata through the UI. Overrides are saved per-URL in localStorage and restored automatically on revisit
Inspection & Debugging
- Schema viewer — View the generated JSON schema for any discovered tool
- Form highlighter — Locate and highlight forms directly on the target page
- Tool execution — Call any tool directly from the sidebar with typed parameter inputs and view results in real time
- Prompt Debugger — Chat interface powered by Chrome's built-in Gemini Nano model (via the Prompt API). The on-device agent autonomously discovers and calls tools based on natural language prompts
- Activity log — Real-time history of tool discovery, augmentation, execution, and navigation events
Environment
- Live preview — Target pages are rendered in a sandboxed Webfuse session alongside the inspector. No browser extension install required.
- Webfuse Extension — Included Manifest V3 content script for direct page introspection (used internally by Webfuse sessions)
- URL history — Recently visited URLs are saved and shown as autocomplete suggestions
Getting Started
Prerequisites
- Node.js 22+
- npm
Setup
git clone https://github.com/nichochar/webmcpinspector.git
cd webmcpinspector
npm install
Create a .env file from the example (required for dev mode):
cp .env.example .env
Fill in your Webfuse widget key and space ID for the development environment:
VITE_WIDGET_KEY_DEV=your_dev_widget_key
VITE_SPACE_ID_DEV=your_dev_space_id
Development
npm run dev
Opens at http://localhost:5173/inspect/.
Build
npm run build
Output goes to dist/.
Lint
npm run lint
Docker
docker build -t webmcp-inspector .
docker run -p 8080:80 webmcp-inspector
The app is served at http://localhost:8080/inspect/ with the landing page at /.
Project Structure
src/
  App.tsx              # Main app — session management, state, messaging
  components/
    Sidebar.tsx        # Tool/form listing, attribute editing, save/reset
    MainContent.tsx    # Iframe container (Webfuse session) + activity log
    PromptPanel.tsx    # Gemini Nano chat UI for tool execution via Prompt API
  types.ts             # Shared TypeScript interfaces
  analytics.ts         # Plausible analytics wrapper

public/
  extension/
    manifest.json      # Webfuse Extension manifest (Manifest V3)
    content.js         # Content script — form scanning, attribute patching,
                       #   imperative tool interception, message bridge
  landing.html         # Static landing page
How It Works
- Connect — Enter a URL. Webfuse opens a sandboxed browser session rendering the target page
- Scan — The content script scans the page for WebMCP-annotated forms and imperative tools registered via
navigator.modelContext - Inspect — Discovered tools appear in the sidebar with their attributes, parameters, and generated schemas
- Augment — Edit WebMCP attributes on any form or add them to plain forms. Changes are applied live via message passing and persisted in localStorage
- Execute — Call imperative tools directly with parameter inputs, or use the Prompt Debugger to have Gemini Nano orchestrate tool calls from natural language
- Debug — The activity log tracks all events. Schema viewer shows the exact JSON schema that would be exposed to an AI agent
Chrome Flags
Some features require experimental Chrome flags:
| Feature | Flag | Chrome Version |
|---|---|---|
| Imperative tools (JS API) | chrome://flags/#enable-webmcp-testing |
146+ |
| Prompt Debugger (Gemini Nano) | chrome://flags/#prompt-api-for-gemini-nano |
138+ |
Related Links
License
MIT
Installing Webmcpinspector
This server has no published package — it is built from source. Open the repository and follow its README.
▸ github.com/aogz/webmcpinspectorFAQ
Is Webmcpinspector MCP free?
Yes, Webmcpinspector MCP is free — one-click install via Unyly at no cost.
Does Webmcpinspector need an API key?
No, Webmcpinspector runs without API keys or environment variables.
Is Webmcpinspector hosted or self-hosted?
Self-hosted: the server runs locally on your machine via the install command above.
How do I install Webmcpinspector in Claude Desktop, Claude Code or Cursor?
Open Webmcpinspector on unyly.org, pick your client tab (Claude Desktop, Claude Code, Cursor) and press Install — the config is generated automatically, no JSON editing.
Related MCPs
Playwright
Browser automation, scraping, screenshots
 by Microsoft
Puppeteer
Browser automation and web scraping.
 by modelcontextprotocol
opentabs-dev/opentabs
Plugin-based MCP server + Chrome extension that gives AI agents access to web applications through the user's authenticated browser session. 100+ plugins with a
 by opentabs-dev
robhunter/agentdeals
1,500+ developer infrastructure deals, free tiers, and startup programs across 54 categories. Search deals, compare vendors, plan stacks, and track pricing chan
 by robhunter
Compare Webmcpinspector with
Not sure what to pick?
Find your stack in 60 seconds
Author?
Embed badge for your README
Browse similar
All browse MCPs