loading…
en/
Browse all
Without
Cloudera Data Visualization Server
FreeEnables AI agents to manage Cloudera Data Visualization resources including groups, users, roles, segments, workspaces, datasets, visuals, connections, and migr
About
Enables AI agents to manage Cloudera Data Visualization resources including groups, users, roles, segments, workspaces, datasets, visuals, connections, and migrations via natural language.
README
A Model Context Protocol server that exposes the full Cloudera Data Visualization (CDV) REST API to AI agents. This lets LLMs list, create, update, and delete CDV resources—groups, users, roles, segments, filter associations, workspaces, datasets, visuals, and data connections—as well as run jobs, query the data API, import/export migrations, and perform operational debugging tasks.
Tools
Groups
| Tool | Description |
|---|---|
list_groups |
List all groups |
get_group(object_id) |
Get a group by ID |
create_group(body) |
Create a new group |
update_group(object_id, body) |
Update a group by ID |
delete_group(object_id) |
Delete a group by ID |
Users
| Tool | Description |
|---|---|
list_users |
List all users |
get_user(object_id) |
Get a user by ID |
update_user(object_id, body) |
Update a user by ID |
edit_user_profile(username, body) |
Edit a user's profile by username |
Roles
| Tool | Description |
|---|---|
list_roles |
List all roles |
get_role(object_id) |
Get a role by ID |
create_role(body) |
Create a new role |
update_role(object_id, body) |
Update a role by ID |
delete_role(object_id) |
Delete a role by ID |
Segments
| Tool | Description |
|---|---|
list_segments |
List all segments |
get_segment(object_id) |
Get a segment by ID |
create_segment(body) |
Create a new segment |
update_segment(object_id, body) |
Update a segment by ID |
delete_segment(object_id) |
Delete a segment by ID |
Filter Associations
| Tool | Description |
|---|---|
list_filter_associations |
List all filter associations |
get_filter_association(object_id) |
Get a filter association by ID |
create_filter_association(body) |
Create a new filter association |
update_filter_association(object_id, body) |
Update a filter association by ID |
delete_filter_association(object_id) |
Delete a filter association by ID |
Workspaces
| Tool | Description |
|---|---|
list_workspaces |
List all workspaces |
get_workspace(object_id) |
Get a workspace by ID |
create_workspace(body) |
Create a new workspace |
update_workspace(object_id, body) |
Update a workspace by ID |
delete_workspace(object_id) |
Delete a workspace by ID |
Datasets
| Tool | Description |
|---|---|
list_datasets |
List all datasets |
get_dataset(object_id) |
Get a dataset by ID |
create_dataset(body) |
Create a new dataset |
update_dataset(object_id, body) |
Update a dataset by ID |
delete_dataset(object_id) |
Delete a dataset by ID |
Visuals
| Tool | Description |
|---|---|
list_visuals |
List all visuals (charts/dashboards) |
get_visual(object_id) |
Get a visual by ID |
create_visual(body) |
Create a new visual (raw API body) |
update_visual(object_id, body) |
Update a visual by ID |
delete_visual(object_id) |
Delete a visual by ID |
create_smart_visual(dataset_id, visual_type, title, columns, workspace_id?) |
Create a chart visual — only exposes patterns confirmed to work via the API |
Supported visual_type values for create_smart_visual:
| Type | Use case | Notes |
|---|---|---|
trellis-bars |
Bar chart — one measure vs. one dimension | Measure on x, dimension on y |
trellis-groupedbars |
Grouped bars — one SUM measure, split by color dimension | Use "shelf": "color_shelf" for grouping |
pie |
Pie chart — SUM measure by dimension | Dimension auto-placed on color_shelf |
All other CDV chart types require configuration in CDV's interactive builder and are blocked here to prevent broken visuals.
What is blocked and why:
| Pattern | Error returned | Alternative |
|---|---|---|
count aggregate |
CDV generates count([col]) that Impala rejects |
Use sum on a numeric column |
trellis-lines, scatter, etc. |
Unsupported visual type | Use CDV's builder; use query_dataapi for the data |
Columns starting with avg_, sum_, etc. as measure targets |
CDV tokenizer bug produces avg([avg_col]) |
Choose a different column |
| Date/timestamp columns as dimensions | CDV bracket conversion fails for TIMESTAMP | Use CDV's builder for time-series |
filters parameter |
WHERE ([col]) bracket SQL Impala rejects |
Use query_dataapi for filtered queries; add filters in CDV's builder |
| Deleting dashboards | Cascade-deletes ALL linked chart visuals | Record visual IDs first; use delete_visual carefully |
Connections
| Tool | Description |
|---|---|
list_connections |
List all data connections |
get_connection(object_id) |
Get a connection by ID |
create_connection(body) |
Create a new connection |
update_connection(object_id, body) |
Update a connection by ID |
delete_connection(object_id) |
Delete a connection by ID |
export_connection(object_id) |
Export a connection definition by ID |
Migrations
| Tool | Description |
|---|---|
export_migration |
Export all CDV artifacts as a migration bundle |
import_migration(body) |
Import a CDV migration bundle |
Data API
| Tool | Description |
|---|---|
query_dataapi_get(params) |
Query /apps/dataapi via GET with optional parameters |
query_dataapi_post(body) |
Query /apps/dataapi via POST with a JSON body |
query_data_get(params) |
Query /api/data via GET with optional parameters |
query_data_post(body) |
Query /api/data via POST with a JSON body |
Jobs
| Tool | Description |
|---|---|
run_job(body) |
Trigger a job run |
run_extract(body) |
Run an existing extract job |
create_extract(body) |
Create a new extract job definition |
Debugging / Operations
| Tool | Description |
|---|---|
get_gc_monitor |
Retrieve GC monitor statistics |
post_gc_monitor(body) |
Trigger a GC monitor action |
get_gc_stats |
Retrieve GC statistics |
post_gc_stats(body) |
Trigger a GC stats action |
get_log_levels |
Get log levels for all loggers |
set_log_level(body) |
Set the default log level |
get_logger_level(logger_name) |
Get log level for a specific logger |
set_logger_level(logger_name, body) |
Set log level for a specific logger |
get_toggle_cprofile |
Get current cProfile tracing state |
toggle_cprofile(body) |
Toggle cProfile tracing on/off |
reset_dataconnection_cache(connection_id) |
Reset the cache for a data connection |
reset_dataset_cache(dataset_id) |
Reset the cache for a dataset |
Examples
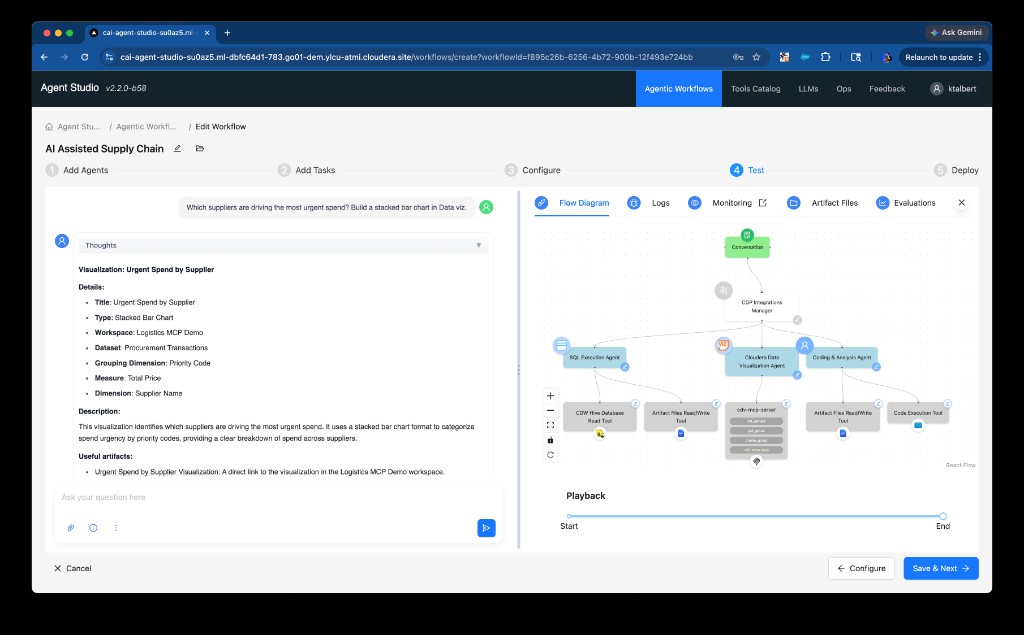
Cloudera Agent Studio — AI Assisted Supply Chain
The screenshots below show the CDV MCP Server being used inside Cloudera Agent Studio as part of an AI-powered supply chain workflow. The user asked a natural language question and the agent automatically:
- Discovered the available connections and datasets
- Explored the
procurement_transactionstable schema - Planned the right visualization type and column mapping
- Called
create_smart_visualto build a stacked bar chart in CDV - Called
create_dashboardto make it visible in the Logistics MCP Demo workspace
Prompt: "Which suppliers are driving the most urgent spend? Build a stacked bar chart in Data viz."
Step 1 — Agent plans the visualization
The agent reasons through the dataset, identifies supplier_name as the dimension, priority_code as the color grouping, and total_price (sum) as the measure, then maps these to a trellis-groupedbars visual type.
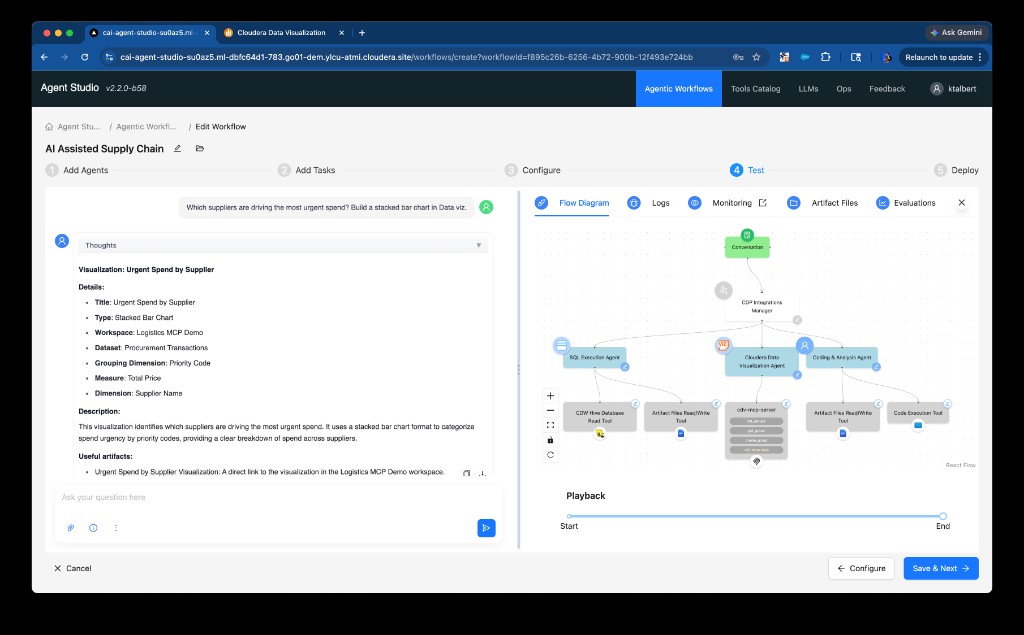
Step 2 — Visual created and linked in CDV
The agent confirms the visualization details, creates the chart via create_smart_visual, wraps it in a dashboard with create_dashboard, and returns a direct link to the new artifact in the Logistics MCP Demo workspace.
Agent Workflow Guidance
CDV Data Hierarchy
CDV organizes data in three layers, each building on the one below:
Connection  (links to an external database, e.g. Impala, Hive, Spark SQL)
  └── Dataset  (points to a specific table or query within that connection)
        └── Visual / Dashboard  (chart or dashboard built on a dataset)
Agents must respect this hierarchy when exploring or creating resources.
Discovery — Always Check Before Creating
Before creating anything, always discover what already exists at each level.
Step 1 — Connections
Call list_connections to see what data sources are registered in CDV.
Present the list to the user and identify which connection holds their data.
Only offer create_connection if no suitable connection exists and the user explicitly asks for one.
Step 2 — Datasets
Call list_datasets to see what datasets already exist (these are built on top of connections).
Present the results and ask the user which dataset to use.
Only offer create_dataset if no suitable dataset exists on the right connection and the user explicitly confirms they want a new one. Note that create_dataset requires a dc_id — the connection ID from Step 1.
Step 3 — Visuals / Dashboards
Call list_visuals to see what charts/dashboards already exist before building new ones.
Only call create_smart_visual or create_visual once the dataset has been confirmed.
Never assume anything needs to be created. CDV instances typically already have connections, datasets, and even visuals the user can reuse.
Correct flow:
User: "Build me a bar chart of shipment costs"
Agent: list_connections()            ← discover data sources
Agent: "I found these connections: ..."
Agent: list_datasets()               ← discover existing datasets
Agent: "Which dataset should I use?"
User: "Use supplier_shipping_performance"
Agent: list_workspaces()             ← identify target workspace
Agent: create_smart_visual(...)      ← now build the visual
Incorrect flow (avoid):
User: "Build me a bar chart of shipment costs"
Agent: create_connection(...)        ← ❌ never skip discovery
Agent: create_dataset(...)           ← ❌ never create without confirming first
Agent: create_smart_visual(...)
Workspace Discovery — Same Rule Applies
Always call list_workspaces before creating a visual or dashboard. Identify the correct workspace ID from the list; only call create_workspace if the user explicitly requests a new one.
Visual Creation Workflow
When create_smart_visual is used:
- Call
list_connections→ understand available data sources. - Call
list_datasets→ confirm dataset with user (note whichdc_idit belongs to). - Call
list_workspaces→ identify the target workspace ID. - Call
create_smart_visualwithdataset_id,workspace_id, and column specs.- If the Smart Visual API returns 404 (not available on all CDV instances), the tool automatically falls back to the standard admin API using the provided
workspace_id.
- If the Smart Visual API returns 404 (not available on all CDV instances), the tool automatically falls back to the standard admin API using the provided
Environment Variables
| Variable | Required | Description |
|---|---|---|
CDV_BASE_URL |
Yes | Base URL of your CDV deployment (e.g. https://my-cdv.example.com) |
CDV_API_KEY |
Yes | CDV API key — sent as Authorization: apikey <key> |
MCP_TRANSPORT |
No | Transport protocol: stdio (default), http, or sse |
Usage with Claude Desktop
Add the following to the mcpServers section of your claude_desktop_config.json:
Option 1: Direct installation from GitHub (Recommended)
{
  "mcpServers": {
    "cdv-mcp-server": {
      "command": "uvx",
      "args": [
        "--from",
        "git+https://github.com/kevintalbert/cdv-mcp-server@main",
        "run-server"
      ],
      "env": {
        "CDV_BASE_URL": "https://my-cdv-instance.example.com",
        "CDV_API_KEY": "your-api-key-here",
        "CDV_USERNAME": "vizapps_admin",
        "CDV_PASSWORD": "vizapps_admin"
      }
    }
  }
}
Option 2: Local installation (after cloning the repository)
{
  "mcpServers": {
    "cdv-mcp-server": {
      "command": "uv",
      "args": [
        "--directory",
        "/path/to/CDV-MCP-Server",
        "run",
        "src/cdv_mcp_server/server.py"
      ],
      "env": {
        "CDV_BASE_URL": "https://my-cdv-instance.example.com",
        "CDV_API_KEY": "your-api-key-here",
        "CDV_USERNAME": "vizapps_admin",
        "CDV_PASSWORD": "vizapps_admin"
      }
    }
  }
}
For Option 2, replace /path/to/CDV-MCP-Server with your local path.
Local Development
# Install uv if you haven't already
curl -LsSf https://astral.sh/uv/install.sh | sh

# Install dependencies
uv sync

# Run the server (stdio transport, default)
uv run run-server

# Run with HTTP transport
MCP_TRANSPORT=http uv run run-server
You can also create a .env file in the project root with your credentials:
CDV_BASE_URL=https://my-cdv-instance.example.com
CDV_API_KEY=your-api-key-here
CDV_USERNAME=vizapps_admin
CDV_PASSWORD=your-cdv-password
Transport
The MCP server's transport protocol is configurable via the MCP_TRANSPORT environment variable:
stdio(default) — communicate over standard input/output. Useful for local tools, CLI scripts, and integrations like Claude Desktop.http— expose an HTTP server. Useful for web-based deployments and microservices.sse— use Server-Sent Events (SSE) transport. Useful for existing web-based deployments that rely on SSE.
Authentication
The server uses two separate authentication mechanisms with different capability levels:
| Credential | Env Var | Required | Unlocks |
|---|---|---|---|
| CDV Admin API Key | CDV_API_KEY |
Always | Data exploration, admin CRUD, connections, datasets, workspaces, users, groups, migrations, jobs |
| CDV Username + Password | CDV_USERNAME / CDV_PASSWORD |
Optional | create_smart_visual, create_dashboard, create_visual, update_visual, delete_visual |
Without CDV_USERNAME / CDV_PASSWORD
When session credentials are absent, chart and dashboard creation tools are not registered in the MCP server at all — they will not appear in the agent's tool list. The server operates in a read/explore-only mode for visuals:
- ✅
query_dataapi— run SQL queries, explore data - ✅
list_connections,list_datasets,list_workspaces— discover resources - ✅
list_visuals,get_visual— inspect existing dashboards - ✅ All admin tools (users, groups, roles, datasets, etc.)
- ❌
create_smart_visual— not available - ❌
create_dashboard— not available - ❌
create_visual/update_visual/delete_visual— not available
Why two credentials?
CDV's admin API (arc/adminapi/v1/visuals) creates visual metadata (title, type, dataset) but does not persist shelf configurations (which columns appear on which axes). Shelf data is stored through CDV's UI API (arc/reports/report/{id}), which requires a browser-style session login. Without CDV_USERNAME/CDV_PASSWORD, visuals would be created as empty skeletons that render blank in CDV's frontend.
The session is cached in memory and reused across tool calls within a server process.
Copyright (c) 2025 - Cloudera, Inc. All rights reserved.
Install Cloudera Data Visualization Server in Claude Desktop, Claude Code & Cursor
Run in your terminal:
claude mcp add cloudera-data-visualization-mcp-server -- npx FAQ
Is Cloudera Data Visualization Server MCP free?
Yes, Cloudera Data Visualization Server MCP is free — one-click install via Unyly at no cost.
Does Cloudera Data Visualization Server need an API key?
No, Cloudera Data Visualization Server runs without API keys or environment variables.
Is Cloudera Data Visualization Server hosted or self-hosted?
A hosted option is available: Unyly runs the server in the cloud, no local setup required.
How do I install Cloudera Data Visualization Server in Claude Desktop, Claude Code or Cursor?
Open Cloudera Data Visualization Server on unyly.org, pick your client tab (Claude Desktop, Claude Code, Cursor) and press Install — the config is generated automatically, no JSON editing.


