
Graphein Mcp
FreeNot checkedModel Context Protocol server for Graphein — wraps generate → validate → repair → render → critique into one tool call, and serves Graphein's schema + agent gui

About
Model Context Protocol server for Graphein — wraps generate → validate → repair → render → critique into one tool call, and serves Graphein's schema + agent guide as resources so a model that never saw the API can still build correct charts.
README

Agent-first data visualization from JSON-serializable chart specs.
Graphein
Graphein is a zero-runtime-dependency TypeScript visualization engine. The one rule is: emit one JSON-serializable ChartSpec with a type, a flat data array, and, for cartesian charts, an encoding that maps fields to channels.
That shape is meant for generated code and ordinary application code alike. Specs contain data, marks, encodings, transforms, selections, layout, and formatting, but not callbacks. You can validate a spec before rendering with validateSpec(spec), apply safe JSON Patch repairs with repairSpec(spec), render it with render(container, spec), and inspect the result with chart.report().
For coding agents
Most visualization libraries assume a human in an editor: write code, look at the canvas, adjust, and repeat. A coding agent has no editor and no eyes on the result — it emits text and needs to know whether that text produced a correct chart without looking at a screen. Graphein is designed around that constraint.
A spec is plain JSON, so a model emits one object instead of imperative drawing code or a config tree laced with callbacks. Every step after generation then returns structured data instead of pixels: validation reports errors with JSON Patch fixes, repairSpec applies the safe ones, chart.report() grades the rendered model for clipped labels, legend overflow, and low-contrast colors, and summarize(spec) writes deterministic alt text. The whole generate → validate → repair → render → verify loop closes in JSON, with no human and no vision model. See The spec loop for the mechanics, and graphein-mcp to expose that loop to MCP clients as tools.
| Capability an agent relies on | Graphein | Imperative (e.g. D3) | Config libraries (e.g. Chart.js, Plotly) | JSON grammar (e.g. Vega-Lite) |
|---|---|---|---|---|
| Spec is plain, serializable JSON | Yes | No, imperative code | Partial, config plus callbacks | Yes |
| Pre-render validation with fixable errors | Yes, JSON Patch | No | No | Partial, unstructured errors |
| One-call automatic repair | Yes | No | No | No |
| Post-render critique without a vision model | Yes, report() |
No | No | No |
| Deterministic natural-language summary | Yes, summarize() |
No | No | No |
| First-class MCP server | Yes | No | No | No |
Because selections and dashboards are data too, an agent can emit, store, diff, and replay an entire interactive page as JSON — not just a static picture, but a chart it can generate, check, and explain.
The core package includes the chart model, scales, ticks, colors, transforms, layout, Canvas2D mark rendering, DOM/SVG overlays, tables, matrix pivots, slicers, and dashboards. It ships without runtime dependencies. Native rendering lives in @graphein/node; React support lives in @graphein/react; MCP integration lives in graphein-mcp.
Gallery
Live gallery → spatney.github.io/graphein — every chart family, plus a Playground to edit a spec live (validate → repair → render → report). Run npm run gallery to open it locally.
Twenty-four specs below — every chart type plus KPI cards, tables, pivot matrices, and a slicer — each a single JSON ChartSpec, shown across light, dark, and hand-drawn sketch. All render headless: this image is generated by @graphein/node, not a browser.
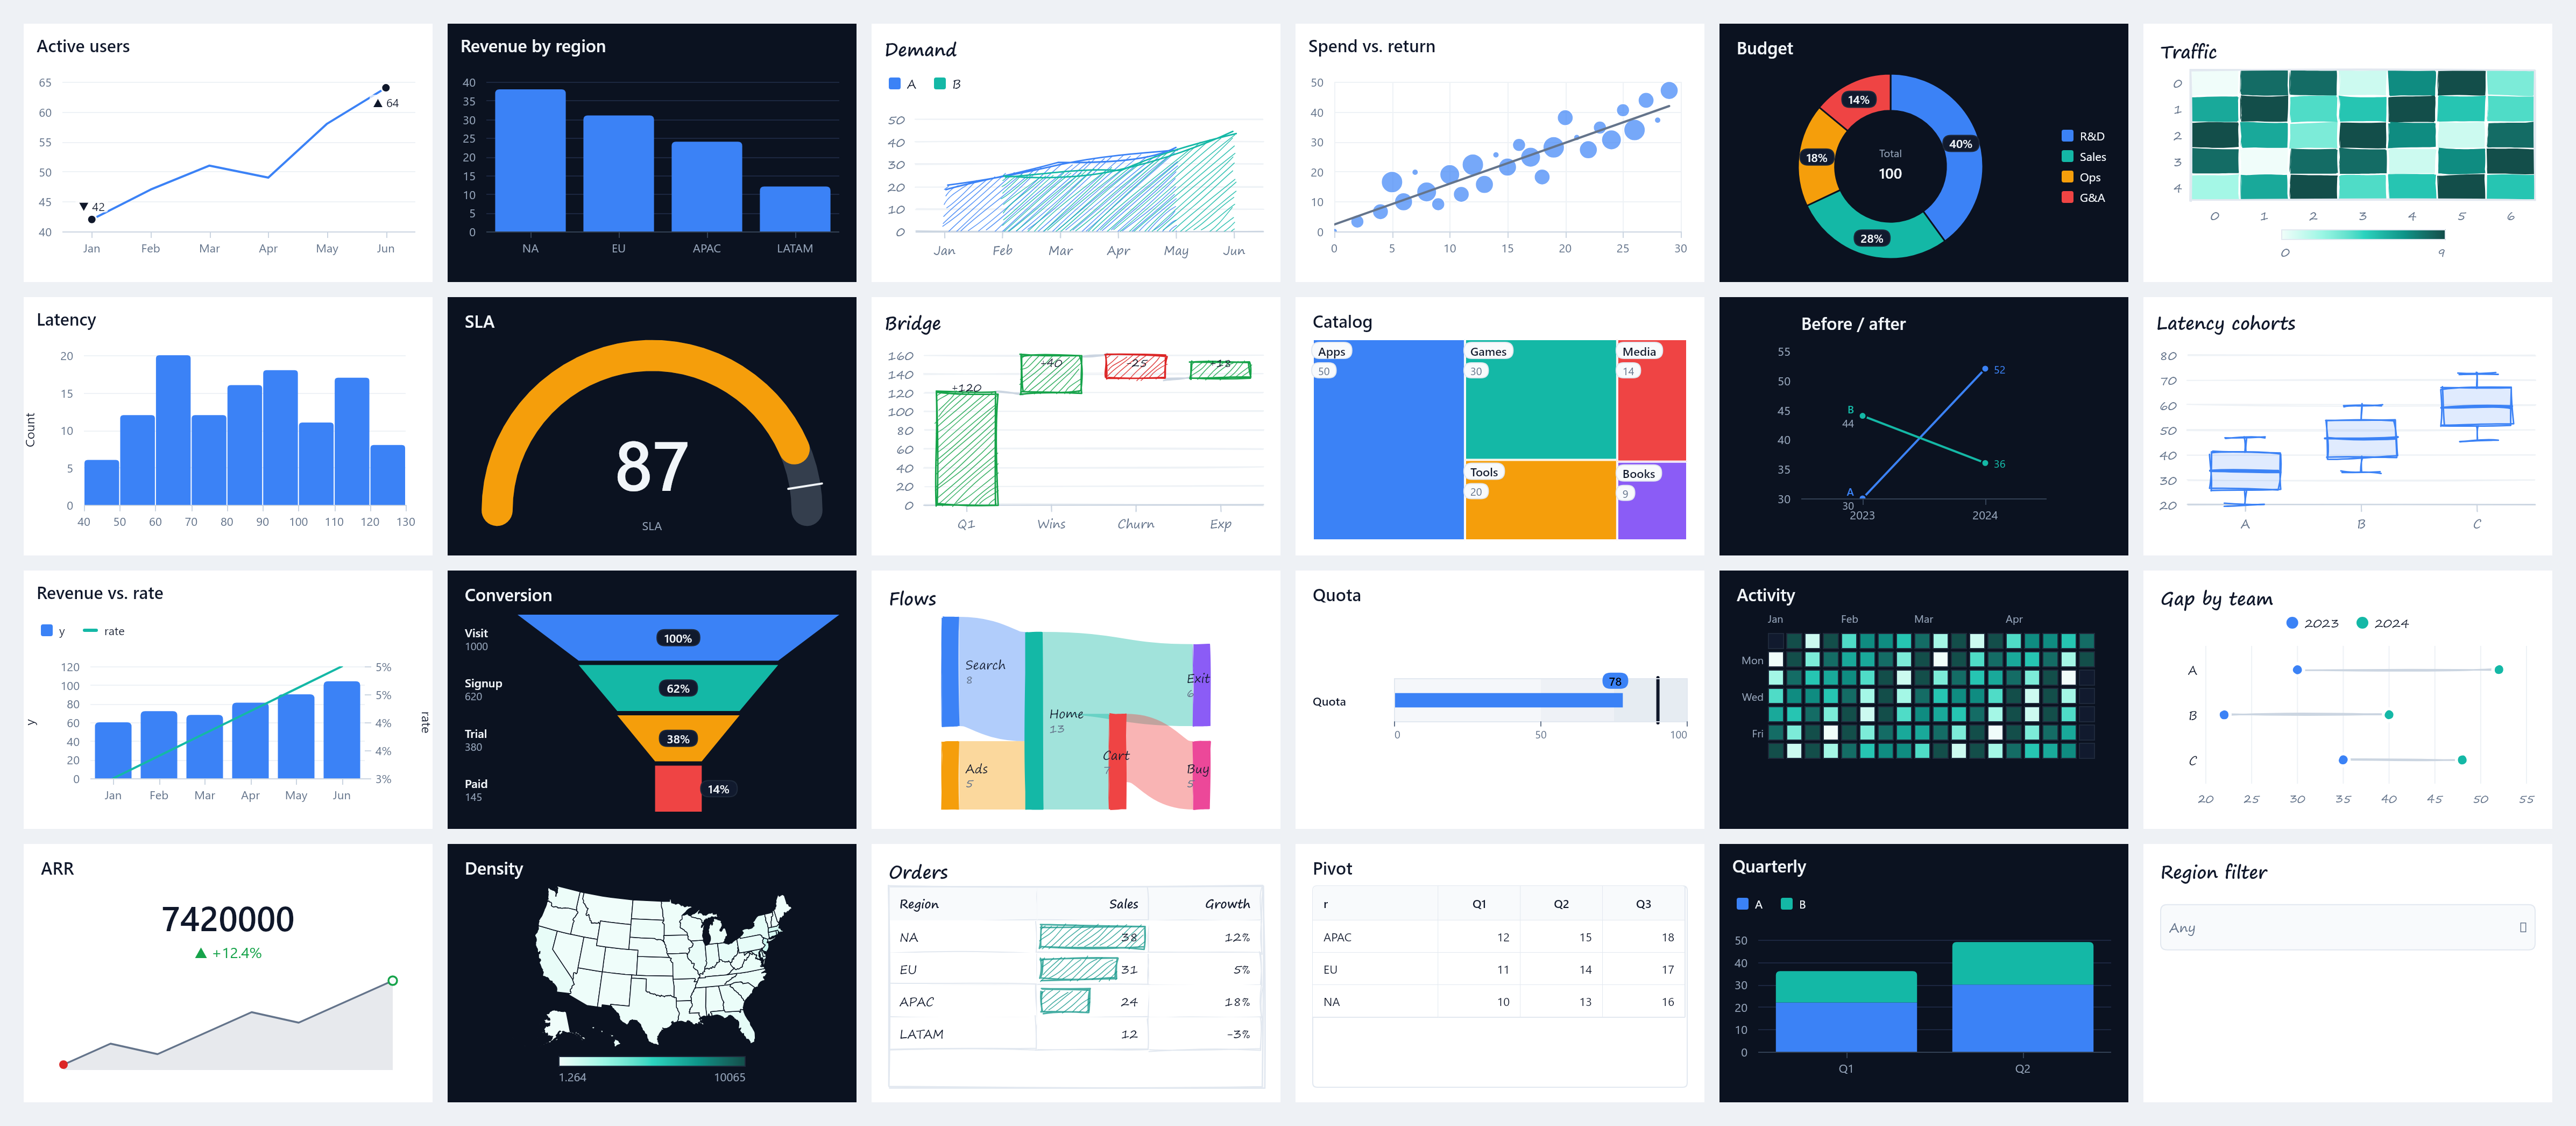
Same spec, three looks: set "theme": "dark" or "sketch": true to switch.
Install
npm install graphein
import { render, validateSpec } from 'graphein';
For React, install the wrapper alongside React:
npm install @graphein/react react
import { Chart } from '@graphein/react';
For headless PNG output in Node:
npm install @graphein/node graphein
import { renderChart } from '@graphein/node';

const { png, report } = renderChart(spec, { width: 900, height: 480, dpr: 2 });
For MCP clients:
{
  "mcpServers": {
    "graphein": { "command": "npx", "args": ["-y", "graphein-mcp"] }
  }
}
graphein-mcp exposes four tools: render_chart, validate_chart, repair_chart, and summarize_chart. It also serves the agent guide, JSON Schema, and spec reference as MCP resources.
Quick start
import { render, validateSpec } from 'graphein';
import type { ChartSpec } from 'graphein';

const spec: ChartSpec = {
  type: 'line',
  title: 'Monthly active users',
  data: [
    { month: '2024-01', users: 4200 },
    { month: '2024-02', users: 4650 },
    { month: '2024-03', users: 5010 },
    { month: '2024-04', users: 4880 },
    { month: '2024-05', users: 5430 },
    { month: '2024-06', users: 6120 },
  ],
  encoding: {
    x: { field: 'month', type: 'temporal' },
    y: { field: 'users', type: 'quantitative', format: ',d' },
  },
};

const result = validateSpec(spec);
if (result.valid === false) throw new Error(result.errors[0]?.message ?? 'Invalid chart spec');

const chart = render('#app', spec);

chart.update({ ...spec, title: 'Monthly active users, H1' });
chart.resize();
chart.destroy();
React
import { Chart } from '@graphein/react';

export function UsageChart({ spec }) {
  return (
    <div style={{ height: 360 }}>
      <Chart spec={spec} />
    </div>
  );
}
<Chart spec={...} /> fills its container, updates when spec changes, and tears down on unmount. useChart(spec) is available when you want to attach Graphein to your own element. React is a peer dependency.
The spec loop
A generated spec should go through the same path as a handwritten one:
- Build tidy row-oriented data.
- Pick a
typeand map fields throughencoding, or use the fields required by the non-cartesian spec. - Call
validateSpec(spec). If errors include safe fixes, callrepairSpec(spec)and validate again. - Render with
render(container, spec)or<Chart spec={spec} />. - Use
chart.report()to check mark counts, clipped labels, legend overflow, contrast diagnostics, and the generated summary.
import { repairSpec, render, validateSpec } from 'graphein';

const firstPass = validateSpec(spec);
const fixed = firstPass.valid ? spec : repairSpec(spec).spec;
const secondPass = validateSpec(fixed);

if (secondPass.valid === false) {
  throw new Error(secondPass.errors.map((error) => error.message).join('\n'));
}

const chart = render('#app', fixed);
const report = chart.report();
validateSpec reports structural errors with paths and, when the correction is unambiguous, RFC 6902 JSON Patch fixes. repairSpec applies the safe fixes. chart.report() is computed from the resolved render model, so agents and tests can detect common render issues without image inspection.
summarize(spec) returns a deterministic natural-language description and is also surfaced through chart.report().summary and the chart aria-description. Set insights: true on line, area, or bar to label the max and min. Set trendline: true on scatter, line, or area to derive a linear fit; { label: true } adds an R² label. Set facet: { field } on line, area, bar, or scatter for small multiples with shared scales.
Chart types
| Type | Use | Key fields |
|---|---|---|
line |
Trends over time or another ordered x field | encoding.x, encoding.y, optional series |
area |
Filled trends and stacked part-to-whole over time | encoding.x, encoding.y, optional series, stack |
bar |
Category comparisons | encoding.x, encoding.y, optional series, stack, group |
combo |
Multiple cartesian layers on shared x, including bar plus line | encoding.x, layers[] |
scatter |
Relationship between two measures | encoding.x, encoding.y, optional size, color |
histogram |
Distribution of one quantitative field | encoding.x, optional bin, density |
pie |
Shares of a total, with optional donut mode | encoding.theta, encoding.color, optional donut |
heatmap |
Density or magnitude across two categories | encoding.x, encoding.y, encoding.color |
box |
Distribution by group | encoding.x, encoding.y, optional series |
funnel |
Ordered conversion stages | encoding.stage, encoding.value |
sankey |
Weighted flows between nodes | encoding.source, encoding.target, encoding.value |
choropleth |
Values joined to GeoJSON features | geo, encoding.key, encoding.color, optional featureId |
treemap |
Hierarchical part-to-whole | encoding.category, encoding.value, optional group, color |
gauge |
Single value against a bounded scale | value, max, optional target, bands |
bullet |
Compact value versus target | value, optional target, ranges |
calendarHeatmap |
Daily values over a year-style grid | encoding.date, encoding.color |
waterfall |
Running total from signed deltas | encoding.stage, encoding.value, optional showTotal |
slope |
Before/after or ordered change by series | encoding.x, encoding.y, encoding.series |
dumbbell |
Gap between groups per category | encoding.category, encoding.value, encoding.group |
kpi |
Single-number tile — degrades to a plain card, or grows into a scorecard with delta, sparkline, and comparison rows | value, optional label, delta, sparkline, comparisons |
table |
Tabular detail with sorting, totals, and conditional formatting | columns |
matrix |
Pivot or cross-tab with aggregates | rows, columns, values |
Examples live in docs/examples. The field-by-field contract is in docs/spec-reference.md, and the generated JSON Schema is in docs/chart-spec.schema.json.
Dashboards and slicers
A dashboard spec composes views on a grid and shares a selection store across them. Views may use their own data or inherit dashboard data. With interactions: 'auto', slicers filter compatible views, and chart selections cross-highlight charts that share fields.
The five slicer visual types are dropdown, list, search, range, and dateRange. Each reads a field and publishes a named param; consumers use filter: [{ param }] or highlight: { param }.
import { renderDashboard, validateSpec } from 'graphein';
import type { DashboardSpec } from 'graphein';

const dashboard: DashboardSpec = {
  type: 'dashboard',
  data: rows,
  views: [
    {
      id: 'region',
      title: 'Region',
      spec: { type: 'dropdown', field: 'region', multiple: true },
      w: 3,
      h: 2,
    },
    {
      id: 'sales',
      title: 'Sales',
      spec: {
        type: 'bar',
        encoding: { x: { field: 'region' }, y: { field: 'sales' } },
        filter: [{ param: 'region' }],
      },
      w: 9,
      h: 4,
    },
  ],
  interactions: 'auto',
};

validateSpec(dashboard);
const instance = renderDashboard('#app', dashboard);
instance.setSelection({ region: ['West'] });
Dashboard layout supports sectioned layouts, per-view titles and subtitles, card padding, backgrounds, responsive spans, and presets such as auto, kpi-first, and sidebar.
Rendering and accessibility details
Graphein uses Canvas2D for data marks and gridlines, with an HTML/SVG overlay for text, legends, titles, tooltips, KPI cards, and accessibility attributes. Interaction state paints on a separate canvas so hover does not require a full redraw. When rendering settles, the root gets data-graphein-ready="true" and window.__GRAPHEIN_READY increments for automation.
@graphein/node renders canvas-backed charts to PNG with @napi-rs/canvas and returns the same RenderReport shape as the browser API. It renders every chart type — line, area, bar, scatter, box, pie, heatmap, sankey, choropleth, combo, histogram, funnel, treemap, gauge, bullet, calendarHeatmap, waterfall, slope, dumbbell, plus the formerly DOM-only kpi, table, matrix, slicers, and dashboards, which paint to a static canvas headlessly.
Sketch mode is part of the spec. Set sketch: true for default hand-drawn strokes, hachure fills, and font handling, or pass SketchConfig to tune roughness, bowing, fill style, stroke width, and seed.
Documentation
- Agent Guide: workflow, chart selection, repair loop, dashboards, and recipes for generated specs.
- Spec Reference: fields for every chart, table, matrix, slicer, dashboard, transform, annotation, and theme option.
- JSON Schema: generated schema for
ChartSpecandDashboardSpec. - Examples: runnable JSON specs.
Packages
| Package | Purpose |
|---|---|
| graphein | Framework-agnostic core engine, validators, renderers, transforms, tables, matrices, slicers, and dashboards. |
| @graphein/react | React wrapper with <Chart spec={...} /> and useChart(spec). |
| @graphein/node | Headless PNG rendering for canvas-backed charts. |
| graphein-mcp | MCP server with render_chart, validate_chart, repair_chart, and summarize_chart. |
| apps/gallery | Vite gallery, Playground, and screenshot harness for development. |
| tests/visual | Playwright visual tests. |
Development
This repository uses npm workspaces.
npm install
npm run build
npm test
npm run typecheck
npm run lint
npm run gallery
The core package is intended to remain dependency-free at runtime. After changing TypeScript spec types, run npm run gen:schema and commit the generated docs/chart-spec.schema.json. After changing docs that are bundled into the MCP package, run npm run sync:resources --workspace graphein-mcp. Regenerate the README montage with node tests/visual/readme-montage.mjs.
License
MIT
Install Graphein Mcp in Claude Desktop, Claude Code & Cursor
unyly install graphein-mcpInstalls into Claude Desktop, Claude Code, Cursor & VS Code — handles npx, uvx and build-from-source repos for you.
First time? Get the CLI: curl -fsSL https://unyly.org/install | sh
Or configure manually
Run in your terminal:
claude mcp add graphein-mcp -- npx -y graphein-mcpFAQ
Is Graphein Mcp MCP free?
Yes, Graphein Mcp MCP is free — one-click install via Unyly at no cost.
Does Graphein Mcp need an API key?
No, Graphein Mcp runs without API keys or environment variables.
Is Graphein Mcp hosted or self-hosted?
Self-hosted: the server runs locally on your machine via the install command above.
How do I install Graphein Mcp in Claude Desktop, Claude Code or Cursor?
Open Graphein Mcp on unyly.org, pick your client tab (Claude Desktop, Claude Code, Cursor) and press Install — the config is generated automatically, no JSON editing.
Related MCPs
Fetch
Web content fetching and conversion for efficient LLM usage.
AWS KB Retrieval
Retrieval from AWS Knowledge Base using Bedrock Agent Runtime.
 by modelcontextprotocol
Spring AI MCP Server
Provides auto-configuration for setting up an MCP server in Spring Boot applications.
llm-analysis-assistant
A very streamlined mcp client that supports calling and monitoring stdio/sse/streamableHttp, and can also view request responses through the /logs page. It also
 by xuzexin-hz
Compare Graphein Mcp with
Not sure what to pick?
Find your stack in 60 seconds
Author?
Embed badge for your README
Browse similar
All ai MCPs