
Xlsx Gantt
FreeNot checkedGenerate polished, presentation-ready Gantt charts as Excel .xlsx files from Python, JSON or CSV — no Excel needed, no GUI. Eight themes, a published plan schem

About
Generate polished, presentation-ready Gantt charts as Excel .xlsx files from Python, JSON or CSV — no Excel needed, no GUI. Eight themes, a published plan schema, and an MCP server for AI-assisted planning. Built on openpyxl.
README






Turn Python data into polished, presentation-ready Gantt charts — no Excel required, no GUI needed.
Built on openpyxl. Zero heavy dependencies.

Contents
Getting started: Features · Installation · Quick Start · Command-Line Usage · Themes · Data Structure
Going further: Advanced Usage · Development · Requirements · Contributing · License
Features
- Polished charts out of the box — pick one of eight ready-made colour themes, or generate a matching palette from your brand colour
- No Excel needed to create them — charts are plain
.xlsxfiles anyone can open, filter, and edit in Excel - Simple to use — describe your project as sections and tasks, get a presentation-ready chart; even directly from the command line:
xlsx-gantt chart.json -o gantt.xlsx - Shows what matters — progress bars per task, milestones, who's responsible for what, and automatic time-estimate totals
- Your language, your logo — day and week labels are fully configurable, and your logo can sit in the chart header
- A natural fit for AI-assisted planning — the whole plan is plain dicts or a JSON file, so an LLM or coding agent can draft it, revise it, and regenerate the chart in one step; describe the project in prose, let the model produce the JSON, and run
xlsx-gantt plan.json -o gantt.xlsx - Lightweight — just openpyxl and Pillow; no pandas, no matplotlib, no Java bridge
Installation
pip install xlsx-gantt
This includes everything — all logo image formats (PNG, JPEG, BMP, GIF, TIFF) work out of the box.
Quick Start
from datetime import datetime
from xlsx_gantt import GanttChart, GanttTheme

sections = [
    {
        "name": "Design",
        "tasks": [
            {
                "name": "Requirements gathering",
                "time_estimate": 3,
                "progress": 100,
                "ranges": [
                    {"start": datetime(2026, 1, 5), "end": datetime(2026, 1, 9), "color": "0070C0"},
                ],
                "annotations": {"Alice": "R", "Bob": "S"},
            },
            {
                "name": "Architecture review",
                "time_estimate": 2,
                "progress": 80,
                "ranges": [
                    {"start": datetime(2026, 1, 12), "end": datetime(2026, 1, 14), "color": "0070C0"},
                ],
                "annotations": {"Alice": "R", "Bob": "R"},
            },
        ],
    },
    {
        "name": "Development",
        "tasks": [
            {
                "name": "Backend",
                "time_estimate": 10,
                "progress": 50,
                "ranges": [
                    {"start": datetime(2026, 1, 19), "end": datetime(2026, 2, 6), "color": "00B050"},
                ],
                "annotations": {"Alice": "S", "Bob": "R"},
            },
            {
                "name": "Frontend",
                "time_estimate": 8,
                "progress": 20,
                "ranges": [
                    {"start": datetime(2026, 1, 26), "end": datetime(2026, 2, 13), "color": "00B050"},
                ],
                "annotations": {"Alice": "R", "Bob": "S"},
            },
        ],
    },
    {
        "name": "Milestones",
        "tasks": [
            {
                "name": "Beta release",
                "time_estimate": None,
                "progress": None,
                "ranges": [
                    {"start": datetime(2026, 2, 9), "end": datetime(2026, 2, 9), "color": "FF0000"},
                ],
            },
        ],
    },
]

style = GanttTheme.get("ocean")

chart = GanttChart(
    sections=sections,
    start_date=datetime(2026, 1, 5),    # Monday
    end_date=datetime(2026, 2, 15),     # Sunday
    project_name="My Project",
    resource_names=["Alice", "Bob"],
    style=style,
    logo_path="logo.png",               # optional
)

# Save to disk
chart.generate_excel("gantt_chart.xlsx")

# — or — get raw bytes (no file written)
xlsx_bytes = chart.generate_excel_bytes()
print("Done!")
From a JSON file
Keep the project plan in a JSON file instead of Python code and load it in one line:
from xlsx_gantt import GanttChart, GanttTheme

chart = GanttChart.from_json("chart.json", style=GanttTheme.get("ocean"))
chart.generate_excel("gantt.xlsx")
The JSON mirrors the dict API, with dates as ISO strings — see
Command-Line Usage for a full example file. The same
file also works without any Python at all: xlsx-gantt chart.json -o gantt.xlsx.
Command-Line Usage
Installing the package also installs an xlsx-gantt command that builds a
chart from a JSON file — no Python required:
xlsx-gantt chart.json -o gantt.xlsx --theme ocean [--logo logo.png]
The JSON mirrors the dict API, with dates as ISO strings (YYYY-MM-DD):
{
  "project_name": "Website Redesign",
  "start_date": "2026-03-02",
  "end_date": "2026-04-12",
  "resource_names": ["Alice", "Bob"],
  "sections": [
    {
      "name": "Design",
      "tasks": [
        {
          "name": "Research",
          "time_estimate": 3,
          "progress": 80,
          "ranges": [
            {"start": "2026-03-02", "end": "2026-03-06", "color": "0070C0"}
          ],
          "annotations": {"Alice": "R", "Bob": "S"}
        }
      ]
    }
  ]
}
--theme accepts any name from the Themes table. Invalid input is
reported on stderr with exit code 1.
The CLI is a thin wrapper around GanttChart.from_json(), so the same JSON
file can be loaded from Python too:
chart = GanttChart.from_json("chart.json")
Themes
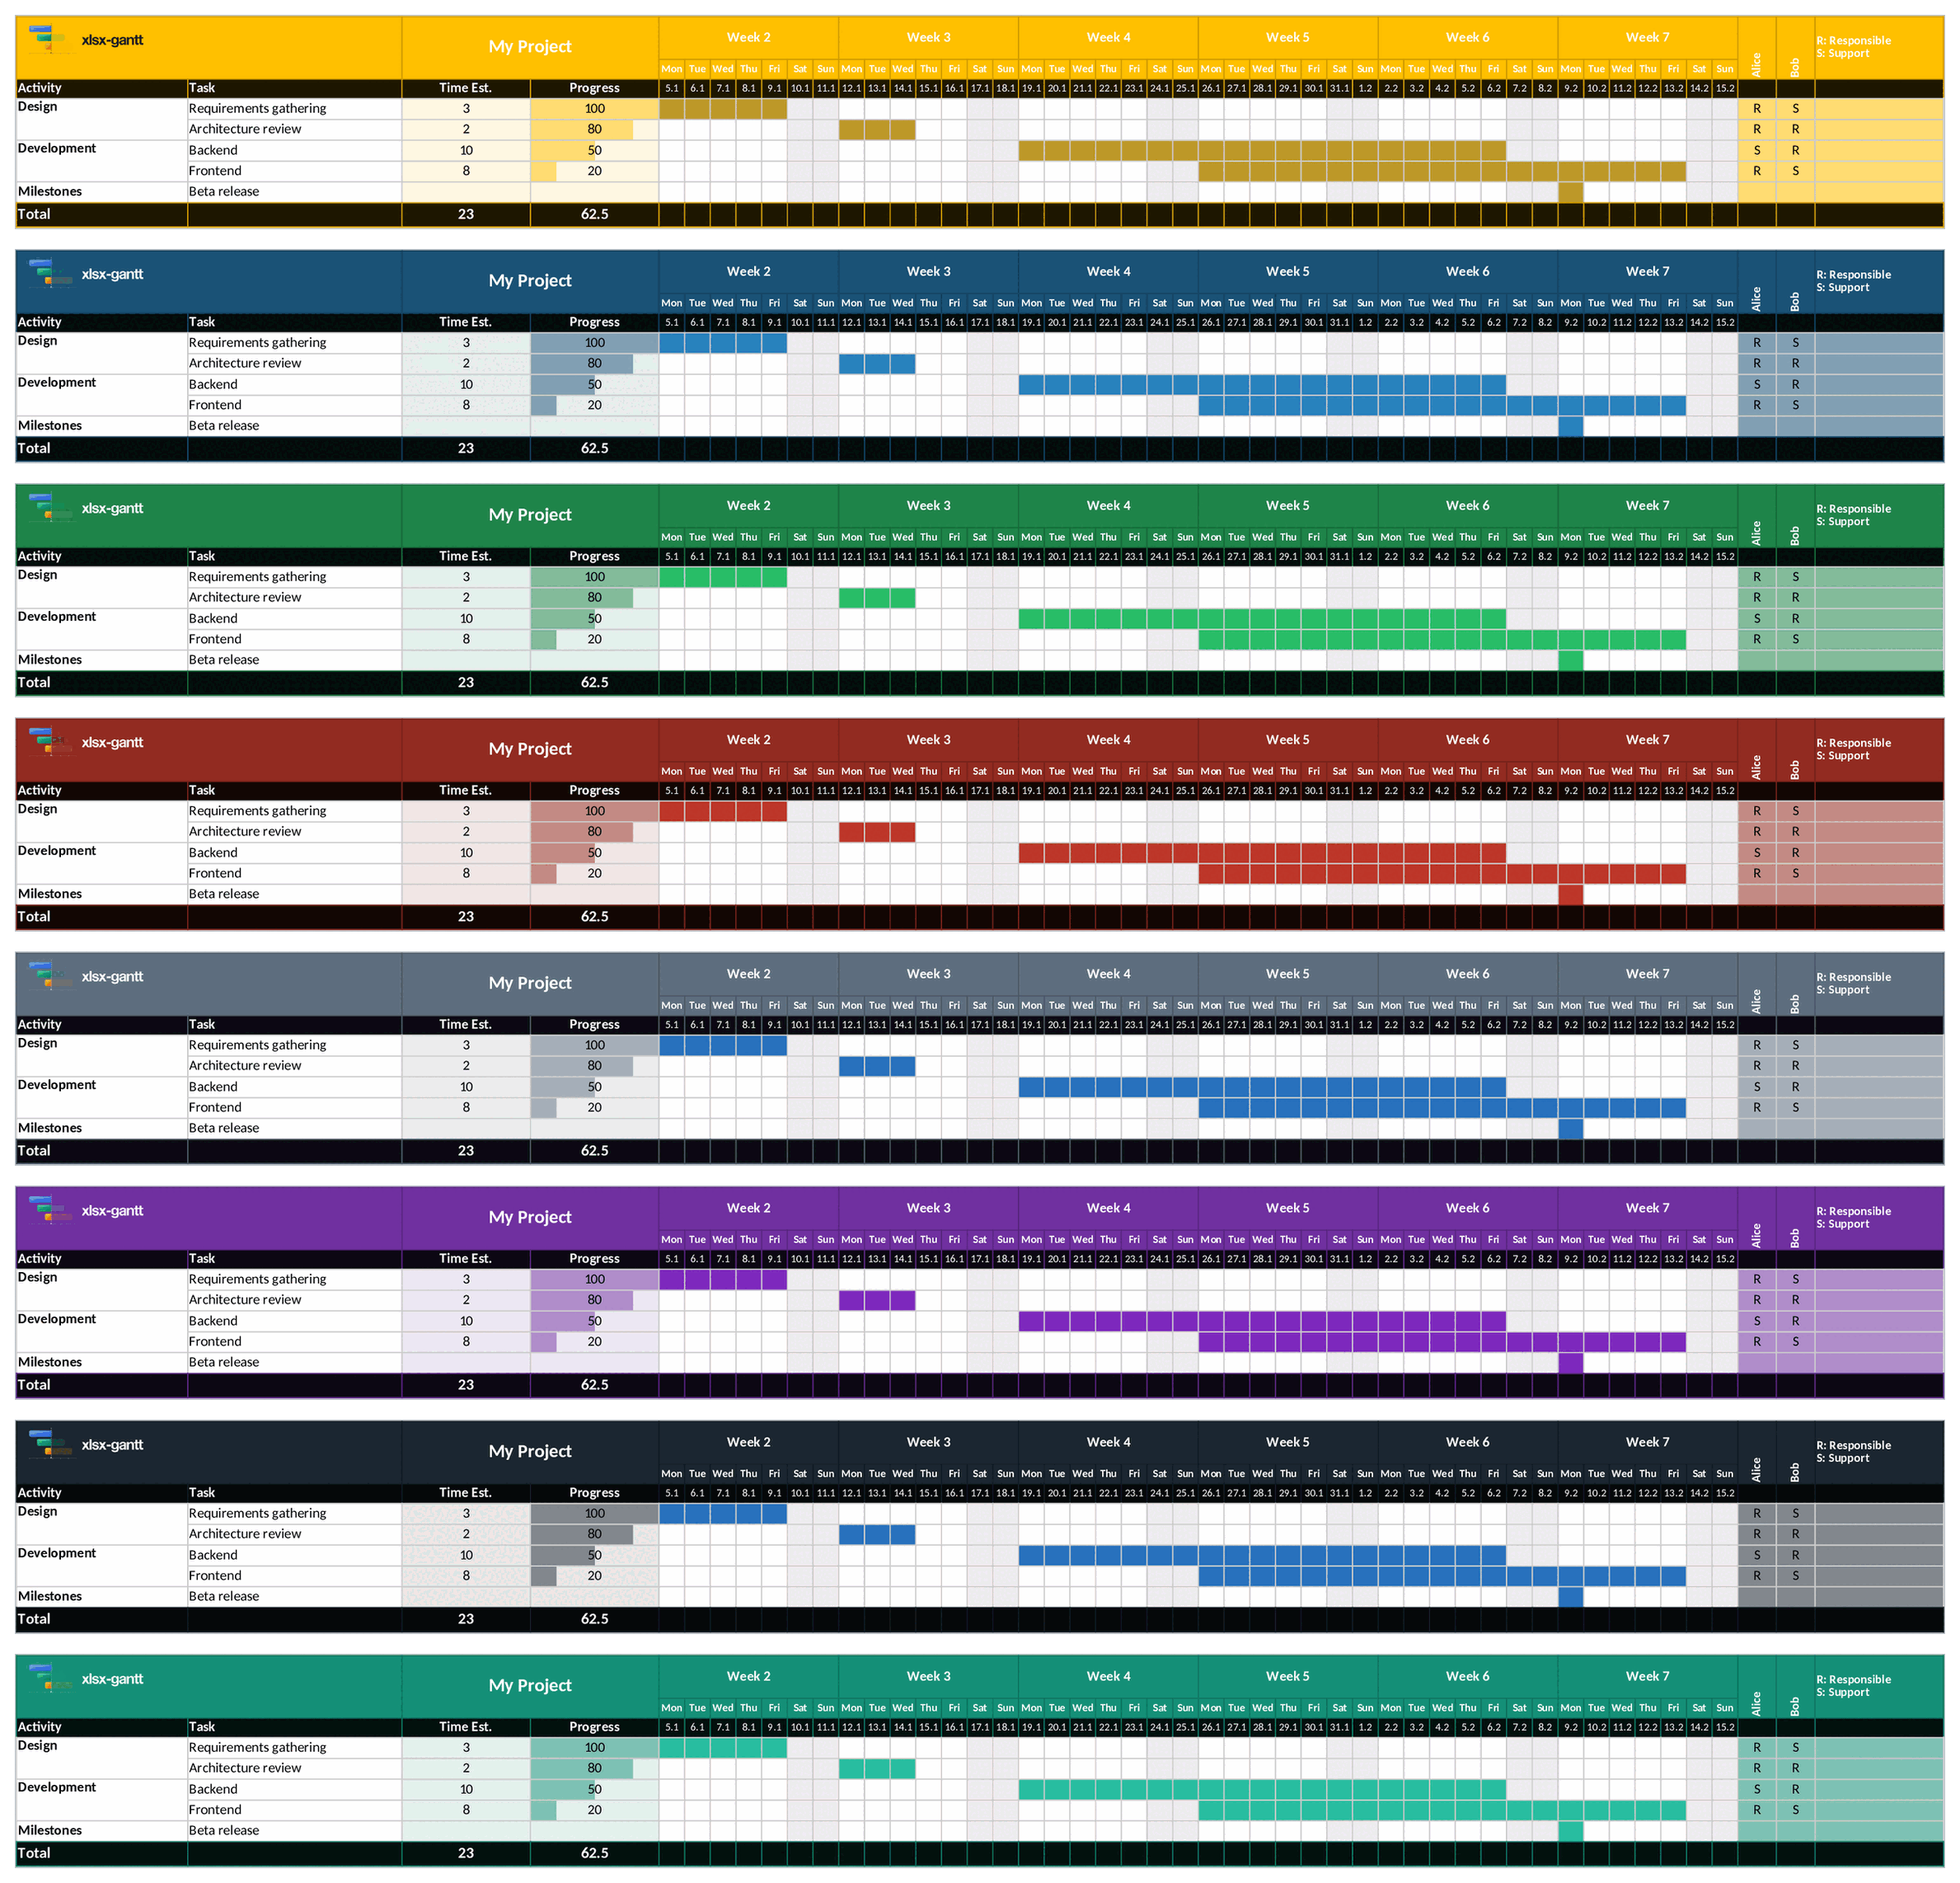
Eight built-in themes are available:
| Name | Description | Base colour |
|---|---|---|
amber |
Warm corporate orange | FFC000 |
ocean |
Deep professional blue | 1A5276 |
forest |
Environmental green | 1E8449 |
crimson |
Bold, high-impact red | 922B21 |
slate |
Minimal neutral gray | 5D6D7E |
royal_purple |
Original default palette | 7030A0 |
midnight |
Modern near-black | 1B2631 |
teal |
Fresh blue-green | 148F77 |
The same chart in every theme, in the order listed above:
from xlsx_gantt import GanttTheme

# By static method
style = GanttTheme.ocean()

# By name (case-insensitive; spaces and hyphens treated as underscores)
style = GanttTheme.get("royal_purple")

# Generated from any base hex colour
style = GanttTheme.from_color("#2E86C1")

# List all available theme names
print(GanttTheme.list_themes())
Data Structure
Sections (dict form)
{
    "name": str,       # section label (merged across all its task rows in column A)
    "tasks": [ ... ]   # list of task dicts (see below)
}
Tasks (dict form)
{
    "name": str,                      # task label
    "time_estimate": float | None,    # hours / days / any unit; summed in the Total row
    "progress": float | None,         # 0–100 %; rendered as a solid DataBar
    "ranges": [                       # one or more coloured bars on the timeline
        {
            "start": datetime,        # inclusive start date
            "end":   datetime,        # inclusive end date (start == end → milestone)
            "color": "RRGGBB",        # 6-digit hex, no '#'; falls back to theme bar colour
        },
        ...
    ],
    "annotations": {                  # optional resource role markers
        "Alice": "R",                 # R = Responsible
        "Bob":   "S",                 # S = Support
    },
}
Note:
time_estimate,progress,ranges, andannotationsare all optional. Omitting them or passingNoneis handled gracefully.
Advanced Usage
Everything below is optional — the sections above cover the common cases.
Typed Dataclass API
Instead of plain dicts you can use the typed Section, Task, and DateRange
dataclasses. Both forms are fully interchangeable and may be freely mixed in the
same sections list.
from datetime import datetime
from xlsx_gantt import GanttChart, GanttTheme, Section, Task, DateRange

sections = [
    Section(
        name="Design",
        tasks=[
            Task(
                name="Requirements gathering",
                time_estimate=3,
                progress=100,
                ranges=[
                    DateRange(
                        start=datetime(2026, 1, 5),
                        end=datetime(2026, 1, 9),
                        color="0070C0",
                    )
                ],
                annotations={"Alice": "R", "Bob": "S"},
            ),
        ],
    ),
]

chart = GanttChart(
    sections=sections,
    start_date=datetime(2026, 1, 5),
    end_date=datetime(2026, 2, 15),
    project_name="My Project",
    resource_names=["Alice", "Bob"],
    style=GanttTheme.get("ocean"),
)
chart.generate_excel("gantt_chart.xlsx")
Mixing dicts and dataclasses
from xlsx_gantt import Section, Task

# Dict section alongside dataclass section — both work
sections = [
    {"name": "Phase 1", "tasks": [{"name": "Kickoff", "progress": 100}]},
    Section(name="Phase 2", tasks=[Task(name="Development", time_estimate=10)]),
]
to_dict / from_dict
Each dataclass provides to_dict() (serialize back to the dict API) and
from_dict() (construct from a raw dict, returning None for invalid input):
from xlsx_gantt import Section, Task, DateRange
from datetime import datetime

dr = DateRange(start=datetime(2026, 1, 5), end=datetime(2026, 1, 9), color="0070C0")
print(dr.to_dict())
# {'start': datetime(2026, 1, 5, 0, 0), 'end': datetime(2026, 1, 9, 0, 0), 'color': '0070C0'}

task = Task.from_dict({"name": "Research", "time_estimate": 3, "progress": 80})
print(task.name)  # Research
In-Memory Output
generate_excel_bytes() returns the raw .xlsx bytes without writing to disk.
Useful for streaming from a web server or attaching to an e-mail:
chart = GanttChart(sections=sections, ...)

# Flask / Django example
xlsx_bytes = chart.generate_excel_bytes()

response = HttpResponse(
    xlsx_bytes,
    content_type="application/vnd.openxmlformats-officedocument.spreadsheetml.sheet",
)
response["Content-Disposition"] = 'attachment; filename="gantt.xlsx"'
Custom Styles
Pass a GanttStyle dataclass instance to override any visual property:
from xlsx_gantt import GanttChart, GanttStyle

style = GanttStyle(
    header_bg        = "2C3E50",
    header_fg        = "FFFFFF",
    bar_color        = "E74C3C",
    row_bg_even      = "F2F3F4",
    section_name_bg  = "D5D8DC",
    annotation_r_bg  = "C8FFCC",   # green tint for "R: Responsible"
    annotation_s_bg  = "FFE4B5",   # amber tint for "S: Support"
    col_label_bg     = "FFC000",
    col_label_fg     = "000000",
)

chart = GanttChart(sections=..., style=style, ...)
Key GanttStyle fields
| Field | Default | Description |
|---|---|---|
header_bg |
"7030A0" |
Background for header rows (rows 1–2) |
header_fg |
"FFFFFF" |
Text colour for header rows |
bar_color |
"9966CC" |
Default Gantt bar fill |
progress_bar_color |
"7030A0" |
Solid DataBar fill colour |
weekend_bg |
"EFEFEF" |
Column fill for Sat/Sun |
row_bg_even |
None |
Even data-row background (None = white) |
row_bg_odd |
None |
Odd data-row background (None = white) |
section_name_bg |
None |
First row of each section |
col_label_bg |
"FFC000" |
Row 3 — Activity / Task / date numbers |
annotation_r_bg |
None |
Background for "R" annotation cells (annotation_a_bg still accepted) |
annotation_s_bg |
None |
Background for "S" annotation cells |
total_row_bg |
None |
Total row background (None → header_bg) |
day_names |
("Mon", …, "Sun") |
Day abbreviations for row 2 (Mon-first) — set your own for other locales |
week_label_format |
"Week {week}" |
Row-1 week band label; {week} and {year} placeholders |
logo_scale |
0.7 |
Logo size as a fraction of the A1:B2 area |
font_name |
"Calibri" |
Font used throughout the sheet |
col_width_task |
25.0 |
Task column width (Excel units) |
col_width_date |
3.0 |
Width of each day column |
All fields and their defaults are documented in the GanttStyle dataclass docstring.
Colour Utilities
The package also exports the colour helpers used internally by the theme engine:
from xlsx_gantt import contrast_text, darken, lighten, rotate_hue

# Pick white or black for maximum WCAG contrast against a background
text = contrast_text("1A5276")   # → "FFFFFF"

# Blend a colour toward black or white
darker  = darken("FFC000", 0.4)
lighter = lighten("FFC000", 0.6)

# Rotate the hue by a given number of degrees (0–360)
comp = rotate_hue("1A5276", 180)
For Power Users
- In-memory output —
generate_excel_bytes()returns raw.xlsxbytes without touching the file system; drop it straight into a Flask/Django response, e-mail it, or cache it in Redis - Theme engine —
GanttTheme.from_color("#2E86C1")derives a complete WCAG-contrast-checked palette from any hex colour; the colour helpersdarken,lighten,rotate_hue, andcontrast_textare exported for your own theme logic - Typed dataclass API —
Section,Task, andDateRangedataclasses give you IDE auto-completion and type checking; plain dicts still work and can be freely mixed in the same list - Multiple bars per row — paint several independent date ranges on a single task row, each with its own hex colour; any range where
start == endrenders as a milestone - Solid progress DataBars — gradient-free Excel 2010 DataBar conditional formatting, injected via
x14extension XML post-processing - Fine-grained styling — every colour, font, column width, and row height is a
GanttStylefield; section names merge vertically, headers freeze, and label columns get auto-filters - Locale control —
GanttStyle.day_namesandweek_label_format(with{week}/{year}placeholders) replace the default English labels - Production-safe error handling — malformed sections, tasks, ranges, and annotations are silently skipped; no unhandled exceptions in live environments
Development
Development install
git clone https://github.com/trondegil/xlsx-gantt.git
cd xlsx-gantt
pip install -e ".[dev]"
Project Structure
xlsx-gantt/
├── xlsx_gantt/                # Library package
│   ├── __init__.py            # Public re-exports
│   ├── style.py               # GanttStyle configuration dataclass
│   ├── models.py              # Section, Task, DateRange input dataclasses
│   ├── chart.py               # GanttChart builder
│   ├── themes.py              # GanttTheme + colour utilities
│   ├── cli.py                 # xlsx-gantt command-line interface
│   ├── py.typed               # PEP 561 marker
│   └── _xlsx_patch.py         # Internal: solid DataBar XML post-processor
├── tests/
│   ├── __init__.py
│   ├── test_malformed_input.py
│   ├── test_new_features.py
│   ├── test_readme_example.py
│   └── test_v020.py
├── pyproject.toml
├── requirements.txt
├── requirements-dev.txt
├── CHANGELOG.md
├── LICENSE
└── README.md
Running the Tests
pip install -r requirements-dev.txt
pytest
The test suite covers:
- Valid input (dict API and dataclass API)
- In-memory output (
generate_excel_bytes) - Mixed dict + dataclass inputs
to_dict/from_dictround-tripspatch_solid_databarswith both file paths andBytesIO- Malformed sections, tasks, ranges, and annotations
- Edge-case chart configurations (empty date ranges,
Nonefields, reversed dates, etc.)
Requirements
| Package | Version | Notes |
|---|---|---|
| Python | ≥ 3.10 | |
| openpyxl | ≥ 3.1.0 | Required |
| Pillow | ≥ 10.0.0 | Required |
Contributing
Contributions are welcome! Here is the recommended workflow:
Fork the repository and create a feature branch:
git checkout -b feature/my-improvementInstall the project in editable mode with dev dependencies:
pip install -e ".[dev]"Make your changes. Keep the following guidelines in mind:
- Follow the existing code style (PEP 8, type hints, docstrings).
- Add or update tests in
tests/for any changed behaviour. - All colour values must be 6-digit hex strings without a leading
#.
Run the test suite and make sure all tests pass:
pytestCommit with a clear, descriptive message:
git commit -m "feat: add X / fix Y"Open a pull request against the
mainbranch describing what you changed and why.
Reporting issues
Please open a GitHub Issue and include:
- Python version (
python --version) - openpyxl version (
pip show openpyxl) - A minimal reproducible example or the full traceback.
License
This project is licensed under the MIT License — see the LICENSE file for the full text.
Dependency licences
Install Xlsx Gantt in Claude Desktop, Claude Code & Cursor
unyly install xlsx-ganttInstalls into Claude Desktop, Claude Code, Cursor & VS Code — handles npx, uvx and build-from-source repos for you.
First time? Get the CLI: curl -fsSL https://unyly.org/install | sh
Or configure manually
Run in your terminal:
claude mcp add xlsx-gantt -- uvx xlsx-ganttStep-by-step: how to install Xlsx Gantt
FAQ
Is Xlsx Gantt MCP free?
Yes, Xlsx Gantt MCP is free — one-click install via Unyly at no cost.
Does Xlsx Gantt need an API key?
No, Xlsx Gantt runs without API keys or environment variables.
Is Xlsx Gantt hosted or self-hosted?
Self-hosted: the server runs locally on your machine via the install command above.
How do I install Xlsx Gantt in Claude Desktop, Claude Code or Cursor?
Open Xlsx Gantt on unyly.org, pick your client tab (Claude Desktop, Claude Code, Cursor) and press Install — the config is generated automatically, no JSON editing.
Related MCPs
Fetch
Web content fetching and conversion for efficient LLM usage.
Roblox Studio
Enables AI coding tools to control Roblox Studio for workspace exploration, instance manipulation, and script management. It provides tools for playtesting, sce
 by paralov
Opencode Omniroute Plugin
OpenCode plugin for the OmniRoute AI Gateway. Drives dynamic model discovery, /connect auth flow, and multi-instance OmniRoute providers via the official @openc
 by GitHub Actions
AWS KB Retrieval
Retrieval from AWS Knowledge Base using Bedrock Agent Runtime.
 by modelcontextprotocol
Spring AI MCP Server
Provides auto-configuration for setting up an MCP server in Spring Boot applications.
llm-analysis-assistant
A very streamlined mcp client that supports calling and monitoring stdio/sse/streamableHttp, and can also view request responses through the /logs page. It also
 by xuzexin-hz
MCP-Agent
A simple, composable framework to build agents using Model Context Protocol by [LastMile AI](https://www.lastmileai.dev)
 by lastmile-ai
Spring AI MCP Client
Provides auto-configuration for MCP client functionality in Spring Boot applications.
mcp.natoma.ai
A Hosted MCP Platform to discover, install, manage and deploy MCP servers by [Natoma Labs](https://www.natoma.ai)
MCPHub
Website to list high quality MCP servers and reviews by real users. Also provide online chatbot for popular LLM models with MCP server support.
Compare Xlsx Gantt with
Not sure what to pick?
Find your stack in 60 seconds
Author?
Embed badge for your README
Browse similar
All ai MCPs